Data Integrity, Why Do You Need It?

Data Integrity, Why Do You Need It?

What is Data Integrity?

Many of us may remember playing a game as a child, commonly referred to as Telephone, where everyone would sit in a circle with the sole responsibility of passing along a message to the next player. The goal of this game was to successfully pass the original message back to the first player without any changes to the original message. If your experiences were anything like mine, you would agree that the final message rarely made it back to the first player in the same state that it left in.  In some cases, the final message was so far from the original that it would induce laughter throughout the whole group. Although this game was supposed to provide laughter and enjoyment during our childhood, it was also a good teaching moment to reinforce the importance of detail and attention. This exercise is a simple demonstration of the importance of data integrity and communication and their reliance on each other.

Data Integrity in the Process Industry

In the human body, blood transports oxygen absorbed through your lungs to your body’s cells with assistance from your heart, while the kidneys are continuously filtering the same blood for impurities. In this example, three systems (heart, kidneys, lungs) are working together to ensure adequate maintenance of the body. Much like the human body, the process industry is complex and requires multiple systems working together simultaneously to achieve their goal. If any system were to break, it would result in reduced performance and possibly, eventual failure. These data integrity challenges are very similar, regardless of whether tasked with designing a new site or maintaining existing facilities.

Chemical plants, refineries, and other process facilities maintain multiple documents that are required to operate the facility safely. Any challenges with maintaining these documents and work processes could result in process upsets, injuries, downtime, production loss, environmental releases, lost revenue, increased overhead, and many more negative outcomes. Below are just a small example of the critical documents that must be updated to reflect actual engineering design:

  • P&IDs
  • Electrical One-Lines
  • Cause & Effects
  • Instrument Index
  • Loop Diagrams
  • Control Narratives
  • Wiring Diagrams
  • Process Control Logic

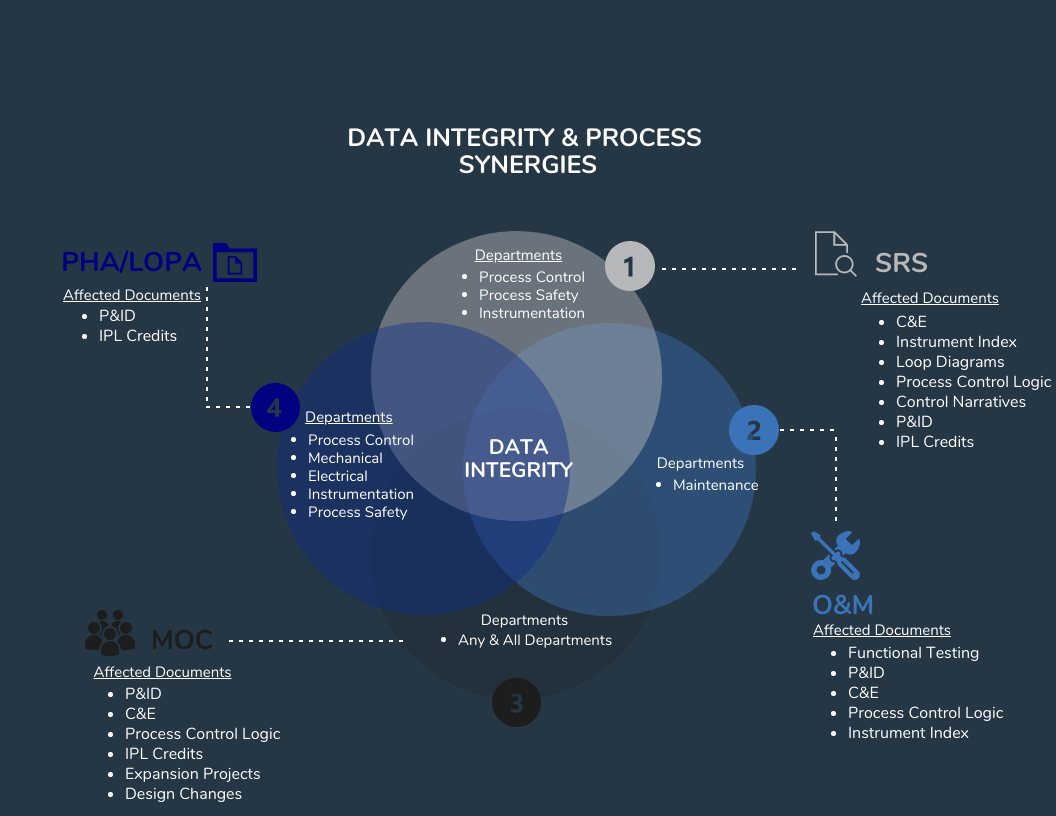
There are many processes and workflows that may trigger required changes to the above documentation, such as PHAs, LOPAs, HAZOPs, MOCs, SRSs, Maintenance Events, and Action Items, to name a few. Each of these processes requires specific personnel from multiple groups to complete. As the example earlier in this blog pointed out, it can be a challenge to communicate efficiently and effectively in a small group, much less across multiple groups and organizations. Data integrity can easily be compromised by having multiple processes and multiple workgroups involved in decisions affecting multiple documents.
Considerations

When starting a new project or becoming involved in a new process, it is essential to consider how the requested changes will affect other workgroups and their respective documentation. Will your change impact others? Could understanding how your changes affect other data and workgroups minimize rework or prevent incidents? Could seeing the full picture help you to make better decisions for your work process? Below are some approaches to consider to improve data integrity and communication in your workspace:

  • Understand how changes you make may affect others
  • Identify duplicated data that exist across multiple databases or files
  • Look for ways to consolidate data and processes
  • Create Procedures to audit required changes
  • Designate Systems of Record (SOR) for all data
  • Implement roles to follow guidelines and maintain integrity and communication


Moving Existing Data into the SLM® solution

Moving Existing Data into the SLM® solution

When considering whether to move Safety Lifecycle Management into the SLM® solution, the question “What do I do with my existing data?” arises. This was a significant concern when the SLM® software was being developed and has thus been addressed. SLM® software has an Adapter Module that provides the tools for importing data into the SLM® system and exporting data to external systems. Import Adapters use an intermediate .csv file, typically created in Excel, to organize data so that the SLM® software can read the data, create the correct object hierarchy, and then import the data into SLM® software data fields. The software import process is illustrated in the figure below


import_image
During planning for an SLM® software installation, the user and Mangan Software Solution staff will review the data that is available for import and identify what Adapters are needed to support data import. During this review, the linkages between Modules and data objects should be reviewed to ensure that after import objects such as HAZOP Scenarios, LOPA’s, IPL Assets, and Devices are properly linked. If large amounts of data from applications for which an Adapter has not yet been created, it usually is advisable to have the MSS team create a suitable Adapter instead of attempting to use a Generic Import Adapter.

Once the user’s data has been exported to the intermediate .csv file a data quality review and clean up step is advisable. Depending upon the data source, there are likely to be many internal inconsistencies that are much easier to correct prior to import. These may be things as simple as spelling errors, completely wrong data, or even inconsistent data stored in the source application. I recall a colleague noting after a mass import from a legacy database to a Smart Plant Instrument database – “I didn’t realize how many ways there were to incorrectly spell Fisher.”

Once the data has been imported, correcting such things can be very tedious unless you are able to get into the database itself. For most users, errors such as this get corrected one object at a time. However, editing these types of problems out of the .csv file is pretty quick and simple as compared to post import clean up.

To Import the data, the User goes to the Adapter Module and choses the desired Import Adapter and identifies the .csv file that contains the data. The SLM® solution does the rest.
It should also be noted that SLM® software is capable of exporting data too. The User selects data types to export along with the scope (e.g. a Site or Unit). The exported data is in the form of a .csv file. This can be used to import data into a 3rd party application, or to use a data template to import more data.

Rick Stanley has over 40 years’ experience in Process Control Systems and Process Safety Systems with 32 years spent at ARCO and BP in execution of major projects, corporate standards and plant operation and maintenance. Since retiring from BP in 2011, Rick has consulted with Mangan Software Solutions (MSS) on the development and use of MSS’s SLM Safety Lifecycle Management software and has performed numerous Functional Safety Assessments for both existing and new SISs.

Rick has a BS in Chemical Engineering from the University of California, Santa Barbara and is a registered Professional Control Systems Engineer in California and Colorado. Rick has served as a member and chairman of both the API Subcommittee for Pressure Relieving Systems and the API Subcommittee on Instrumentation and Control Systems


Digitalizing Safety Information into Intelligence

Digitalizing Safety Information into Intelligence

What is Digital Transformation and how can the SLM® system help?
Digital Transformation is the process of converting non-digital or manual information into a digital (i.e. computer-readable) format. For an organization, a phase of digital transformation is a great opportunity for organizations to take a step back and evaluate everything they do, from the basic operations to complex workflows.

<p?
Digital transformation is a time to understand the potential opportunity involved in a technology investment. It’s an ideal time to ask questions, such as ‘Can we change our processes to allow for great efficiencies that potentially allow for better decision making and cost savings.’ A perfect example could be trending data to identify optimum test intervals based on degradation over time. This could provide cost savings in fewer required tests.

Advantages of Digital Transformation

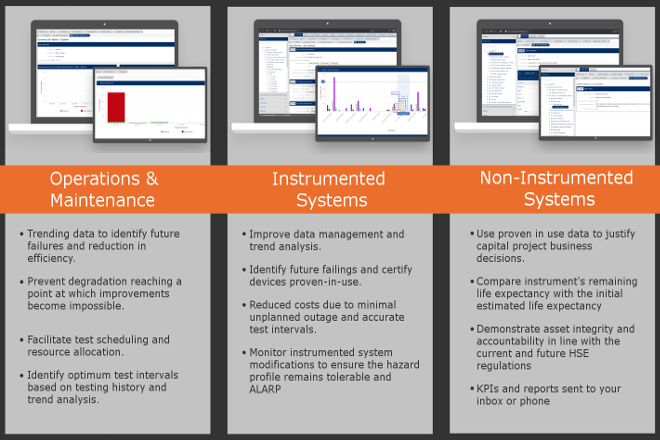
The key tactical benefit of digital transformation is to improve the efficiency of core business processes. In the image below, you can see the efficiencies provided by digital data broken down into three key module areas:

SLM benefits

As you can clearly see, the opportunities provided by digitalization are vast and for this reason Digitalization Demands an Integrated Safety Lifecycle Management System A lot of tools in the market today are single purpose and do not share or exchange data in a way suited to a Safety Lifecycle Management system

Common problems

A lot of organizations we speak with are struggling with lagging indicators and poor reporting systems. This degradation has only gotten worse over time, and this points to a lack of clear and accurate data, overly complex workflows and restrictions brought about by company culture.

At any given point in time organizations are unable to identify the current health of their plant and assets. Bad actors are exceedingly difficult to identify and experience is diminishing with retirements and a reduction in the numbers of subject matter experts.

Digital Transformation Solution

Process Safety and Functional Safety is more than just hardware, software, testing and metrics. Taking a holistic approach and instilling a culture of safety requires a complete end-to-end system that can manage from Initial Hazard Analysis to the final Operations & Maintenance. The SLM® system is the only enterprise platform proven to bring together all aspects of the Safety Lifecycle through digital transformation.

Let SLM® be your digital twin

Let SLM® be your digital twin

Digital twins are powerful virtual representations to drive innovation and performance. Imagine it as a digital replica of your most talented product technicians with the most advanced monitoring, analytical, and predictive capabilities at their fingertips. It is estimated that companies who invest in digital twin technology will see a 30 percent improvement in cycle times of critical processes.

A digital twin captures a virtual model of an organization and helps accelerate strategy. This could be in products, operations, services, and can even help drive the innovation of new business. The model can identify elements that are hindering or enabling strategy execution and suggests specific recommendations based on embedded pattern recognition. Digital twin technology is used to collect more dots and connect them faster, so you can drive to better solutions with more confidence.


digital_twin_cloud

Today’s organizations are complex, evolving systems, built on the collective ambitions and talents of real people operating in a dynamic culture. The world is increasingly defined by data and machine learning, however, there is no simple way to measure human motivation or clear-cut formula for building an effective future.

In a nutshell a digital twin is a tool that can be used to analyze your business to identify potential concerns in any area, and show you how those issues link together. Armed with that information, you can build solutions immediately and overcome the most important obstacles – all before they happen. Get in touch and let our Safety LIfecycle Management tools manage your digital needs.

SLM® for Process Safety Solution

SLM® for Process Safety Solution

Mangan Software Solutions (MSS) is a leading supplier in the Process Safety and Safety Lifecycle software industry. For the past decade, MSS has been leading the market in innovative technologies for the Refining, Upstream Oil & Gas, Chemical, Pipeline, and Biopharmaceutical industries, transforming Process Safety Information into Process Safety Intelligence. MSS’ engineers and programmers are experts in the fields of Safety Lifecycle Management and Safety Instrumented Systems. With a scalable software platform and years of experience working with the premier energy companies in the world, MSS has established itself as the leader in software solutions engineered specific to the clients’ needs.


Process Safety Solutions


SLM® HAZOP Module

With our market leading SLM® software our clients are able to conduct, review, report, and approve HAZOP studies in one place without tedious work in Excel or other closed toolsets that keep you from your data.

The SLM® HAZOP module ensures HAZOP Study uniformity across the enterprise and ensures reporting is standardized and consistent.  It allows direct comparison of hazard and risk assessment between sites or units.

Using our SLM® Dynamic Risk Matrix visually identifies enterprise hazards and risk.. The HAZOP Study data can be filtered based on site, unit, health & safety, commercial, or environmental criteria.

Safety_Life_Framework

SLM® LOPA Module

The SLM® LOPA module now provides intuitive worksheets to standardize your LOPA process and conduct IPL assessments. The Dynamic Risk Matrix is configurable to your risk ranking system and severities and offers real-time risk monitoring and identification. Dynamic reports and KPIs reveal unmitigated risks to allow for IPL gap closure scheduling and progress status. These reports offer unprecedented review of risk mitigation strategies.


hazop-lopa

SLM® Action Item Tracker Module

Identify risks and safeguards and track them with action items from HAZOP meetings through to the implementation of an IPL. The SLM® Action Item Tracker module is a centralized area where users can access assigned action item information pulled from all modules for action or reporting. Data relating to the action item is linked across modules and readily available for reference purposes. Customized reports and KPIs are available with a click of the mouse.

Hazop-of-record

SLM® Functional Safety Assessment Module

The SLM® Functional Safety Assessment (FSA) module allows you to readily complete a Stage 1 through Stage 5 FSA in a standardized format – ensuring consistency throughout your organization. This tool allows you to define requirements for an FSA and then use the application to improve the effectiveness and efficiency of execution.

linking-ipls

Digitalization Demands

Digitalization Demands

Part 2 – Hazard Identification and Allocation of Safety Functions

Digitalization Demands An Integrated Safety Lifecycle Management System (part 1) of this blog series, the general organization of the Safety Lifecycle, as described in IEC 61511, was discussed.  Part 1 highlights the difficulties the application of tools typically used in the day to day operations have with effectively administrating the Safety Lifecycle.

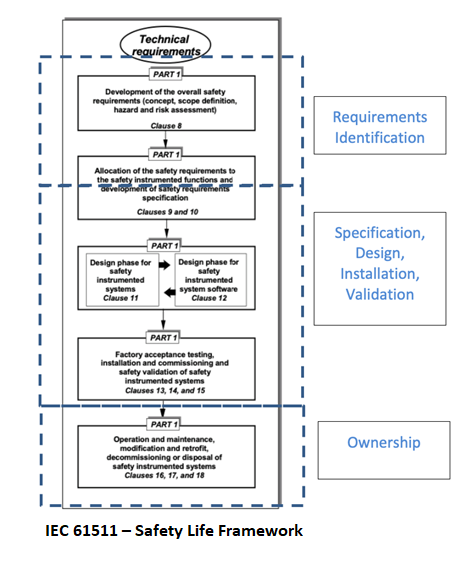
In Part 2 of this blog series, the discussion moves on to a more detailed view of Safety Lifecycle Management for the Requirements Identification phases of the Safety Lifecycle as illustrated in the modified IEC 6111 Figure 1 below.

Safety_Life_Framework

Hazard Identification and Allocation of Safety Functions

While IEC 61511 does not specify procedures, it does require that a hazard and risk assessment be performed and that protective functions that prevent the hazard be identified and allocated as appropriate to Safety Instrumented Functions.

In practice this is usually accomplished by performing a hazard assessment using HAZOP or similar techniques. Scenarios that have a high consequence are then further evaluated using LOPA or similar techniques.

The LOPA studies identify protective functions or design elements that prevent the consequences of the scenario from occurring. These functions and design elements are generally designated as Independent Protection Layers (IPLs) and may take the form of instrumented functions such as Alarms, BPCS and Interlock functions, Physical design elements or Safety Instrumented Functions.

The Traditional Way

The market has a number of Process Hazards Assessment (PHA) software available. However, these software tools are all focused on performing PHAs or associated studies such as LOPAs and are almost always stand-alone tools. The capabilities have generally met the needs of Process Safety Engineers yet have had their limitations. Some of the available packages have attempted to extend their functionality to other phases of the Safety Lifecycle, yet they still tend to fall short of being a complete Safety Lifecycle Management function due to their original PHA focus.


Problems


Stand Alone

The biggest issues with stand-alone PHA and LOPA software packages is the fact that they are “stand alone”. They are self-contained and some of them have such draconian licensing restrictions, that sharing of PHA and LOPA data is extremely limited and often limited to transfer of paper copies of reports. Licensing costs are extremely high which results in organizations restricting the number of licenses that are available. Usually, the PHA and LOPA data can only be accessed from a very limited number of computers (often only one or two within an organization), even in view mode.

Difficult to link PHA and LOPA

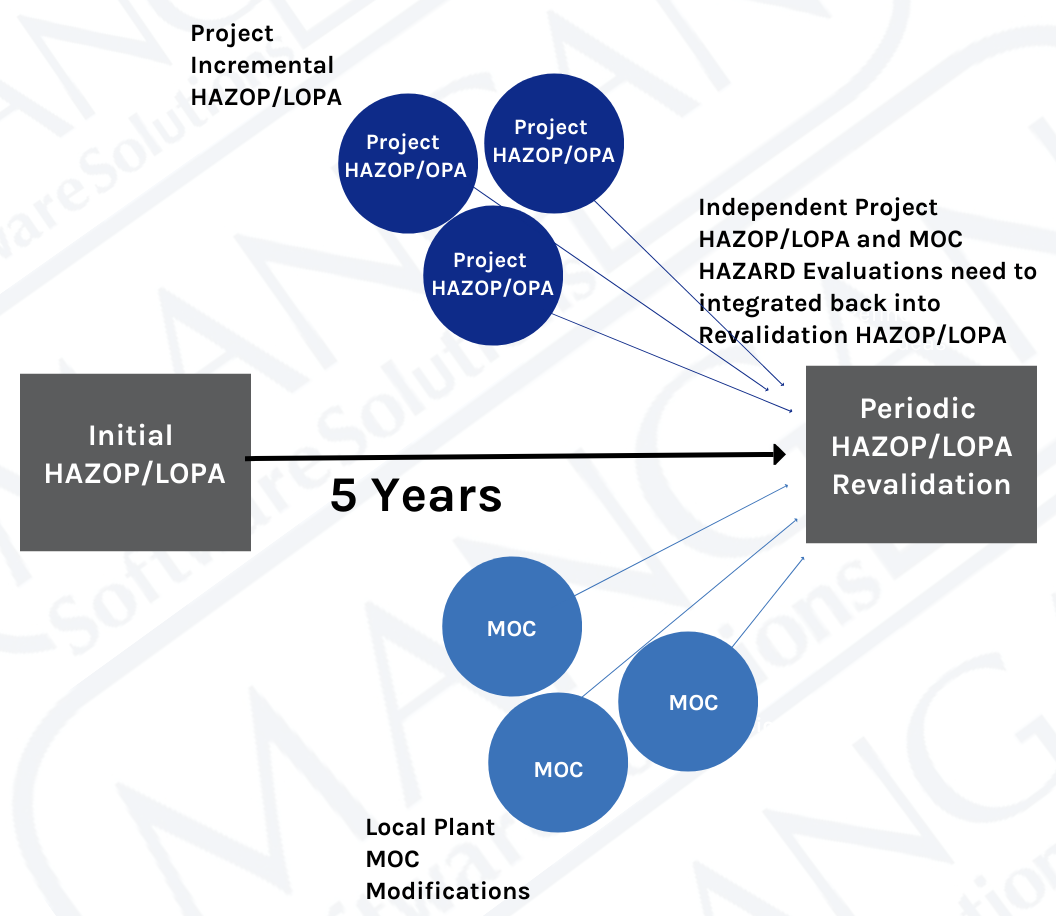
A second major issue is that it is difficult, if not impossible to link PHA and LOPA data for a series of PHA and LOPA studies done on the same process. The typical life cycle of PHA and LOPA studies is that initial studies are done during initial design of a process plant, and then a revalidation of those studies is done every 5 years. Within the 5-year cycle, multiple sub-studies may be done if there are any significant revisions done to the process.

HAZOP of Record

Larger projects may use the same HAZOP tools as used for the HAZOP of Record, but they are usually considered in complete isolation from the HAZOP of Record. Often new nodes are defined that are numbered quite differently than the HAZOP of Record and may not contain the same equipment. As many of these studies are done at an engineering contractor’s office, the same licenses may also not be used. Many smaller modifications may be made that do not use the formal PHA procedure but use perceived simpler methods such as checklists and what-if analysis. The simpler methods are usually resorted because of the extreme licensing limitations noted above.

hazop-lopa

The Independence Mess of Traditional HAZOP Tools

Over a typical 5-year HAZOP cycle, a large number of additional hazard assessments are done, each independent, and often inconsistent with the HAZOP of Record. Project based HAZOPs may be performed on sections of the process with completely different node identifications and node scopes. In effect, there is no current HAZOP of Record as it is partially superseded by these incremental HAZOPs and other hazard assessment. At the time of the 5-year revalidation, integration of all of these independent studies with the prior HAZOP of Record is a major undertaking.

As these applications are stand-alone applications, any associations of Safeguards and IPLs identified during Hazard Analysis with the real Plant Assets used to implement those items must be done externally, if it is done at all. This results in a layer of documentation that is often difficult to manage, of limited availability and not very useful to the operations and maintenance personnel that really need the data

Top 3 Issues with traditional Hazard Identification methods:

  • Licensing restrictions

Licensing restrictions often severely limit access to the data. Furthermore, personnel that need to understand the reasons for various IPLs do not have access to the necessary data.

  • No Clearly Defined Data

IPLs and other Safeguards are usually identified in general terms and often do no clearly define what Plant Assets such as Alarms, BPCS Functions, Interlock Functions and Safety Instrumented Functions correspond to the identified IPLs. This is even more of a gap when a User needs to link an existing Plant Asset back to a specific IPL and PHA scenario.

  • Separate HAZOP and LOPA files

There is no way to integrate HAZOP and LOPAs of Record with incremental HAZOPs, LOPAs, and MOC hazard assessments. This leads to multiple, inconsistent versions of HAZOP and LOPA which then need to be manually resolved, and often are not integrated with the HAZOPs and LOPAs of Record.

5 Major Benefits of Digitalization

An Integrated Safety Lifecycle System, provides functionality that addresses the shortcomings of a system that is based upon single purpose HAZOP and LOPA software. Among the functions that are not provided by traditional PHA and LOPA software are:

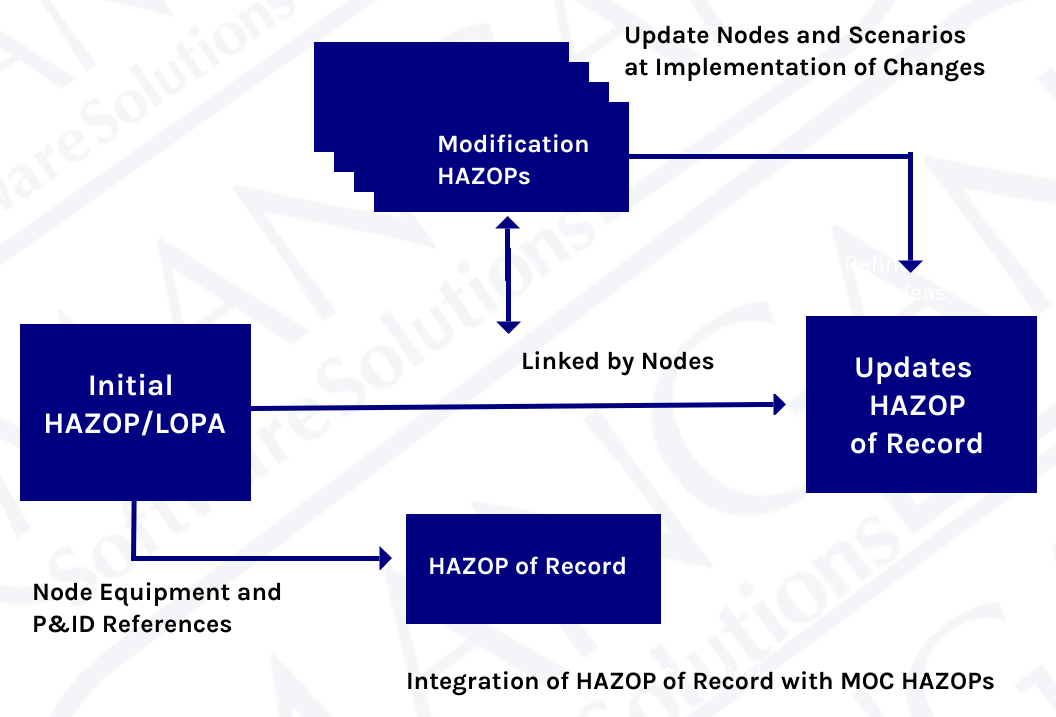
  • The HAZOP and LOPA modules in the software provide functionality to link HAZOPs and LOPAs that are performed as part of Management of Change activities back to the current HAZOP of Record. This assures that Management of Change PHA’s are consistent with the HAZOP of Record in that the same Nodes, Equipment and Scenarios are copied to the MOC PHA’s and become the basis for the hazard assessments.

  • MOC hazard assessment data may be easily integrated back into the HAZOP of Record when the changes are actually integrated. The original versions are kept as archive records, but the HAZOP of Record may be kept up to date and reflect the actual state of the process, and not what it was several years ago. As the incremental HAZOPs and LOPAs are integrated back into the HAZOP and LOPAs of Record as changes are implemented, there is no large task of sorting out all of the studies done since the last HAZOP of Record into a new HAZOP of Record.

  • Integrated Safety Lifecycle Management applications have global access. Licensing restrictions do not limit access to HAZOP and LOPA data to a few licensed computers. However the Integrated Safety Lifecycle Management applications do contain security functions that allow restriction of data access to authorized Users.

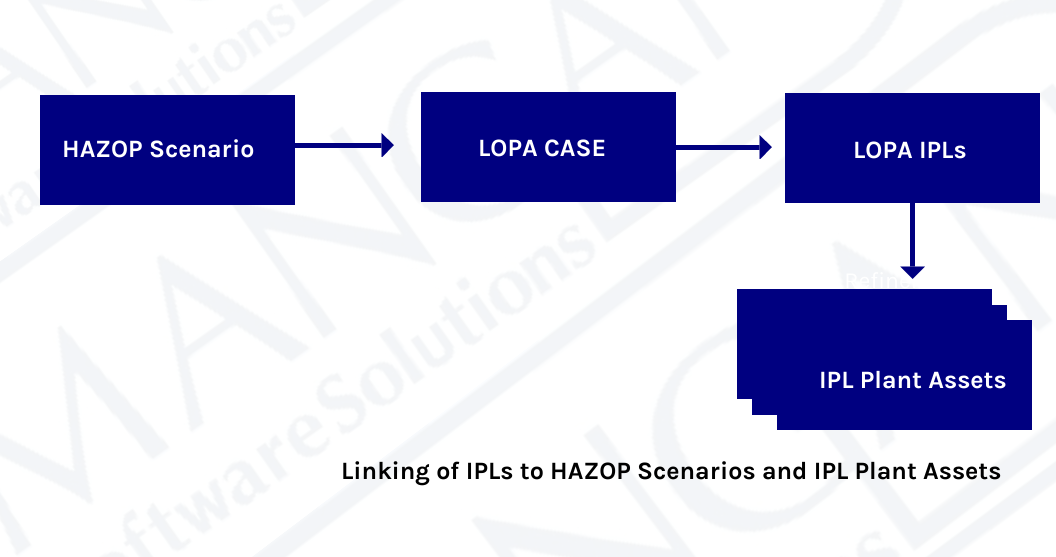
  • IPLs identified by LOPAs are linked directly to the HAZOP scenarios and may also be linked directly to the Plant Assets what implement the IPLs. This means that the Process Safety basis for all IPLs is immediately available to all authorized personnel.

  • Checklists may be associated with IPLs to provide validation of the IPLs ability to mitigate the hazard and its independence from causes and other IPLs. Checklists are available at both the IPL functional level (when an IPL is identified by a LOPA) and a design level (when the Plant Assets that perform the IPLs functions are designed).
Hazop-of-record
linking-ipls

Conclusion

The traditional tools used for Process Hazards Analysis severely limit access to Process Hazards data and do not support other activities required to manage the Safety Lifecycle. Process Hazards data is fragmented and requires major efforts to keep the data current.

In an integrated Safety Lifecycle Management application, HAZOP and LOPA data is readily available to any authorized User. This includes the current HAZOP and LOPAs of Record as well as a full history of prior risk assessment studies. The linking of LOPA identified IPLs to real Plant Assets allow for access of the risk assessment basis for all Plant Assets that perform IPL functions from the Plant Asset data. So an operations or maintenance user can clearly understand why various IPL functions exist and the risks that they are mitigating.

Digitalization Demands An Integrated Safety Lifecycle Management System (part 1)

Digitalization Demands An Integrated Safety Lifecycle Management System (part 1)

An integrated safety lifecycle management system is crucial to properly manage the entire safety lifecycle from cradle to grave. Anyone who has attempted to manage the Safety Lifecycle has quickly realized that the tools that a typical processing facility uses are wholly unsuited to meet the requirements of the Safety Lifecycle.

Most tools available are single purpose and don’t exchange or share information. The tools available are directed towards managing things such as costs, labor management, warehouse inventory management, and similar business-related functions. The systems upon which these functions are based generally use a rigid hierarchy of data relationships and have little flexibility.

An Integrated Safety Lifecycle Management program must supplement or replace the traditional tools to even be considered.  Otherwise, the result is a mix of paper files (or image files on network drives)and a variety of independent word processor and spreadsheet files.  Not to mention the procedures for data collection that fall outside of what the traditional plant management tools will do. This places an unreasonable and unsustainable burden on plant personnel. These systems may be forced to work for awhile, but don’t perform well over time.  Also, its necessary to consider changes of personnel in various positions that occur.

Safety Lifecycle Management

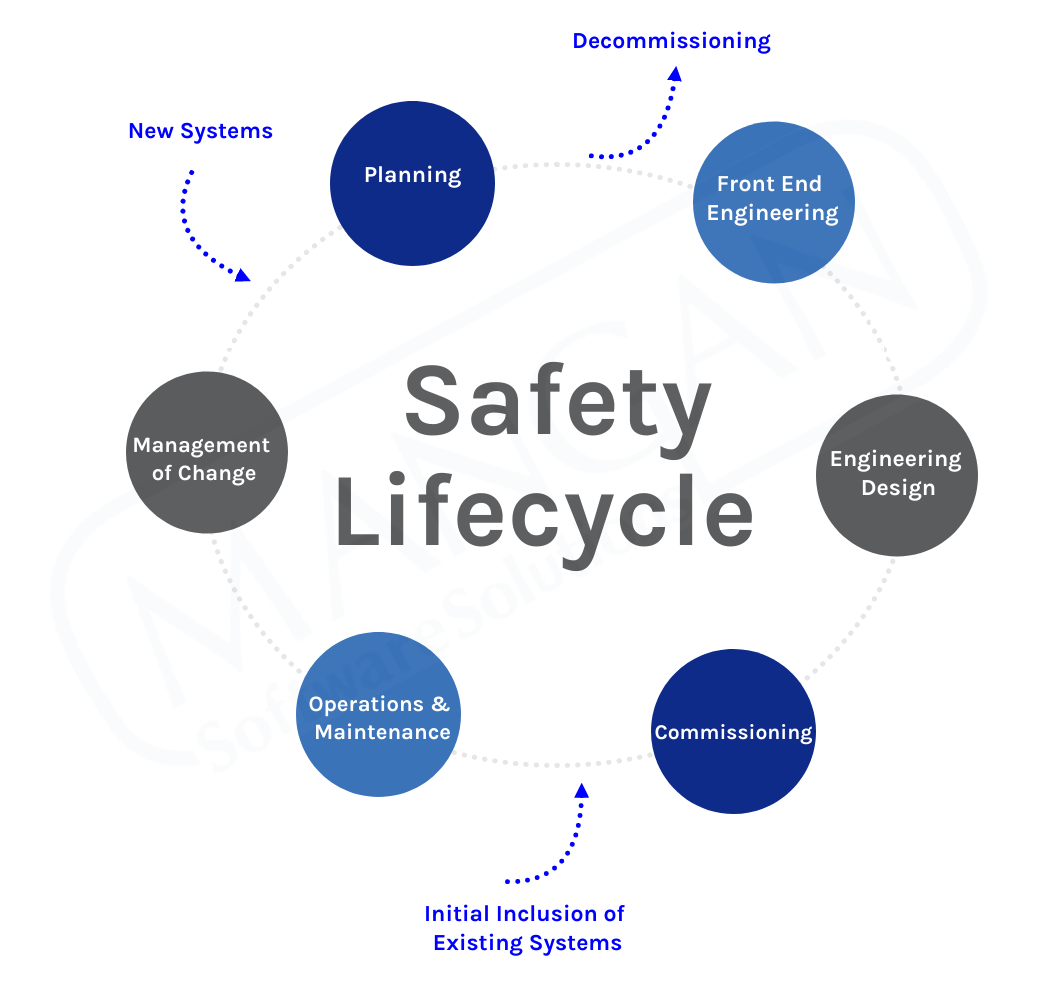
The Safety Lifecycle is a continuous process that originates with the conceptual design of a processing facility and continues throughout the entire service life of that process. Process Safety related functions start their life during the initital Hazard Assessments when potential hazards and their consequences are evaluated. Protective functions are designed to prevent the consequences of the hazards from occurring and their lifecycle proceeds through design, implementation and operation. As plant modifications occur, the existing functions may need to be modified,may be found to no longer be necessary, or new functions are identified as being required. This results in another trip through the lifecycle as illustrated below.

The Safety Lifecycle IEC Regulations  

 IEC 61511, defines the processes that are to be followed when developing, implementing and owning of Safety Instrumented Systems (SIS). While the scope of IEC 61511 is limited to SIS, the concepts also apply to other Protective Functions that have been identified such as Basic Process Control Functions, Interlock, Alarms or physical Protective Functions such as barriers, drainage systems, vents and other similar functions.

The Safety Lifecycle as described in IEC 61511 is shown in the figure below. This figure has been excerpted from IEC 61511 and annotated to tie the various steps with how Process Safety Work is typically executed. These major phases represent work that is often executed by separate organizations and then is passed onto the organizations responsible for the subsequent phase. 


Safety lifecycle management process diagram

1.) Requirements Identification

This phase involves conducting Process Hazards Analyses and identifying the Protective Functions required to avoid the consequences of process hazards from occurring.

The tools typically used for these activities are a Process Hazards Analysis application and Layers of Protection Analysis (LOPA). The CCPS publication Layer of Protection Analysis: Simplified Process Risk Assessment describes the process of identification and qualification of Protective Functions, identified as Independent Protection Layers (IPL’s).

2.)  Specification, Design, Installation and Verification 

This phase is typically thought of as “Design”, but it is so much more:

  • The Specification phase is involving specification of the functional requirements for the identified IPL’s. When the IPL’s are classified as Safety Instrumented Functions (SIF), they are defined in a Safety Requirements Specification as defined by IEC 61511. Other non-SIF IPL’s are defined as described in the CCPS LOPA publication, although the concepts defined in IEC 61511 are also an excellent guide.
  • Once requirements are specified, physical design is performed. The design must conform to the functional, reliability and independence requirements that are defined in the SRS or non-SIF IPL requirements specifications.
  • The designs of the Protective Functions are installed and then are validated by inspection and functional testing. For SIS’s a Functional Safety Assessment as described by IEC 61511 is performed prior to placing the SIS into service.

3.) The Ownership Phase

This is the longest duration phase, lasting the entire life of the process operation. This phase includes:

  • Operation of the process and its Protective Functions. This includes capture of operational events such as Demands, Bypasses, Faults and Failures.
  • Periodic testing of Protective Functions at the intervals defined by the original SRS or IPL requirements. This involves documentation of test results and inclusion of those results in the periodic performance evaluations.
  • Periodic review of Protective Function performance and comparison of in-service performance with the requirements of the original SRS or IPL requirements. If performance is not meeting requirements of the original specifications, identification and implementation of corrective measures is required.
  • Management of Change in Protective Functions as process modifications occur during the process lifetime. This starts a new loop in the Safety Lifecycle where modifications, additions or deletions of Protective Functions are identified, specified and implemented.
  • Final decommissioning where the hazards associated with decommissioning are assessed and suitable Management of Change processes are applied.


CLICK HERE TO READ MORE ON ⇨ A Holistic Approach to the Safety Lifecycle


Execution Challenges

Execution of the Safety Lifecycle interacts with numerous process management tools. Some of those tools that are typically available are illustrated in the figure below. All of these tools have the characteristics that they are generally suitable for the single purposes for which they were chosen, but all of them have limitations that make them unsuitable for use with a Safety Lifecycle Management process.

The Safety Lifecycle involves numerous complex relationships that cross traditional organizational boundaries and require sharing of data across these boundaries. The tools traditionally used in process operational management just don’t fit the requirements of Managing the Safety Lifecycle. Attempts to force fit them to Safety Lifecycle Management results in fragmented information that is difficult to access and maintain or which is just missing, and which results in excessive costs and highly ineffective Safety Lifecycle Management. The work around become so fragmented and complex, they rapidly become unsustainable. 

SRS and SIS engineer data
  • The Value of an Integrated Safety Lifecycle Management System

    An Integrated Safety Lifecycle Management System provides the benefits that an organization expects from the protective systems installed in a facility. The System provides fit for purpose work processes that account for the multiple relationships among the various parts of the Safety Lifecycle that traditional tools do not provide. A few of the high-level benefits are:

        • Consistency and quality of data is vastly improved by using common processes, data selection lists, data requirements and procedures that have been thought out and optimized for the needs of managing protective systems.
        • Design of Protective Functions is made much more efficient due to standardization of the information needed and the ability to copy SRS and non-SIF IPL data from similar applications that exist elsewhere in an organization. Design data is readily available to all authorized Users that need that data.
        • Process Safety awareness is enhanced because the Safety Lifecycle Management System provides links between the originating hazard assessments, PHA Scenarios, LOPA’s, LOPA IPL’s and the Plant Assets used to implement the Protective Functions. Authorized users can readily identify Protective Functions and Plant Assets that implement them, and directly access the process hazards for which the functions were installed to prevent.
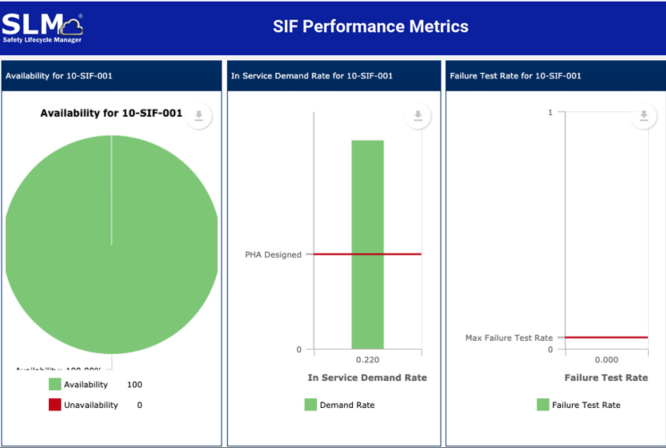
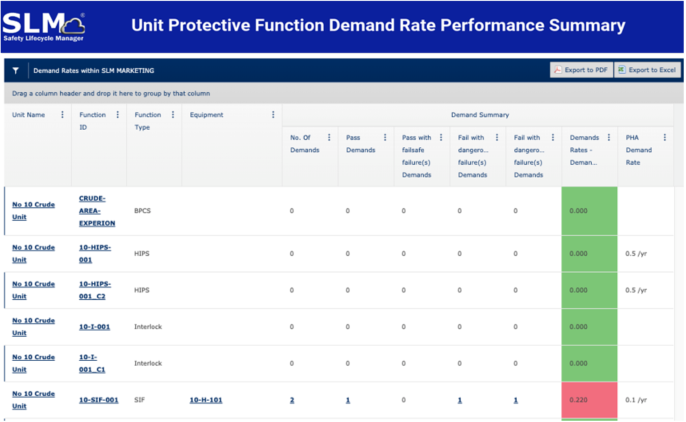
        • Protective Function and associated Plant Asset performance events can be readily captured with a minimum of effort. The Safety Lifecycle Management System collects all of the event data and automatically produces performance data such as Tests Overdue, Tests, Failure Rates, Tests Upcoming, Demand Rates, Failure Rates and Prior Use statistics on a real time basis. The performance can be reported on a Unit, Site or Enterprise basis and can be categorized by Protective Function type, Device Type, Device manufacturer or similar categories. This allows Users to fully understand the conformance of Protective Function and Device performance relative to their Safety Requirements and identify any performance issues.


 Rick Stanley has over 45 years’ experience in Process Control Systems and Process Safety Systems with 32 years spent at ARCO and BP in execution of major projects, corporate standards and plant operation and maintenance. Since retiring from BP Rick has consulted with Mangan Software Solutions (MSS) on the development and use of MSS’s SLM Safety Lifecycle Management software and has performed numerous Functional Safety Assessments for both existing and new SISs.

Rick has a BS in Chemical Engineering from the University of California, Santa Barbara where he majored in beach and minored in Chemical Engineering… and has the grade point to prove it. He is a registered Professional Control Systems Engineer in California and Colorado. Rick has served as a member and chairman of both the API Subcommittee for Pressure Relieving Systems and the API Subcommittee for Instrumentation and Control Systems.

How Accurate Are Safety Calculations

How Accurate Are Safety Calculations

How accurate are safety calculations: If you have ever sat in a LOPA, inevitably there is someone that questions the accuracy of one factor or another. Usually they are trying to justify making an initiating cause less frequent or take more credit for an Independent Protection Layer (IPL).

As unsatisfying as it is, assessment of Process Safety Systems is a statistical adventure. And when you get down to it, people just don’t like, or understand statistics. They find it a playground in which to argue that their number is the “right” number. Statistics are real, but people don’t like to believe them. Otherwise casinos would not be in business.

Evaluation of protective function performance requirements and performance of the designs for those functions requires establishment of probabilities for things like how often an initiating event may occur and how effective mitigating functions are likely to be. Deciding what probabilities to use is the hard part. The problem when it comes to Process Safety Systems is that these probabilities are very fuzzy numbers. How accurate are safety calculations, unlike a pair of dice, which have very precisely defined odds of 7 or snake eyes coming up, real process related risk and failure data is less than precise.

The Process Safety Standards and Practices used by the Process Industries have developed over the past 20-30 years and the various factors used in Process Safety analysis have tended to converge on consensus values. The AIChE CCPS publication, Layers of Protection Analysis, provides a fairly complete set of values for LOPA related factors, and various publications on Safety Instrumented Systems provide representative failure rates for commonly used devices. In these instances, the publications note that the factors actually used are up to the User.

One of the things these publications generally state, is that absent any hard data supporting another value, all of the factors used should be no more accurate than a power of 10. So, factors used are values of 10, 100, 1000, or their inverse (10-1, 10-2, etc). Attempting to use any values that have more precision is usually an exercise in self-delusion. Even the factor of 10 practice is only an approximation. However, the recommend values in reputable publications are based upon the collective experience and judgement of some very experienced and pragmatic people. Unless you have lots of actual in-service data, you don’t really know anything better. Use the expert’s numbers.

When working with input data that only has a precision of powers of 10, you also have to be cognizant that the answer you get after stringing a bunch of them together in a Risk Reduction or PFD calculation, isn’t going to be any more precise than the input data. So that RRF calculation that tells you need a SIF with an RRF of 186 is giving you a false sense of precision. It’s not actually 186, it could be 100 or could be 1000.

This is why ISA 84 ed.2 and IEC 61511 only recognize Safety Integrity Levels (SIL) specified in decades – RRF’s 10, 100, and 1000.   When you are calculating a PFD of a SIF design, that 186 is often used as a hard requirement, when in reality it is a very, very fuzzy target. There is absolutely no basis to say that that a calculated SIF RRF of 130 doesn’t meet the requirements of a LOPA target RRF of 186. Given the accuracy of the input values used, 130 and 186 are the same number.

This doesn’t say that a practice of requiring a SIF design to meet a higher (but not precise) target is wrong.  It does give a design target and tends to result in more thought about the SIF designs. However, you shouldn’t fool yourself into thinking that you are being very precise. If it’s a major expense to get a SIF from 130 to 186, think about whether that really is making a difference.


 Want to learn more about  SLM®?

Click here to download the free white paper!

Slminfo
Rick Stanley has over 40 years’ experience in Process Control Systems and Process Safety Systems with 32 years spent at ARCO and BP in execution of major projects, corporate standards and plant operation and maintenance. Since retiring from BP in 2011, Rick formed his company, Tehama Control Systems Consulting Services, and has consulted with Mangan Software Solutions (MSS) on the development and use of MSS’s Safety Lifecycle Management software.

Rick has a BS in Chemical Engineering from the University of California, Santa Barbara and is a registered Professional Control Systems Engineer in California and Colorado. Rick has served as a member and chairman of both the API Subcommittee for Pressure Relieving Systems and the API Subcommittee on Instrumentation and Control Systems.

Assessing SIF and IPL Performance using SLM

Assessing SIF and IPL Performance using SLM

Assessing SIF and IPL Performance using SLM 84.01.00 and IEC 61511 Part 1, require that the performance of Safety Functions be assessed at regular intervals. The Operate-Maintain Module in Mangan Software Services’ SLM application can provide the user with real time performance data through availability and Probability of Failure on Demand (PFD) calculations performed on a daily basis. This eliminates the need to manually pull records periodically (or spend excessive time hunting, and perhaps not even finding them) and calculate performance.

Performance data is presented in reports Assessing SIF and IPL Performance using SLM displays at the Enterprise, Site, Unit and Function levels.

  • At the Enterprise Level, data is rolled up by Site
  • At the Site Level, data is rolled up by Unit
  • At the Unit Level, data is rolled up by the SIF or IPL Function

Why use Views and Reports?

 They allow users to easily monitor and identify trends such as unusually good or poor performance in a Unit or Site and bore down to the bad actors. The API Tier 3 Management View/Report provides a summary of Independent Protective Layer (IPL) performance by IPL type using values calculated from Events. Values such as Demand Rates, Failure Rates on Demand or Test, Overdue or upcoming tests, and the overall availability of SIF and IPL’s are presented. SLM also provides performance reports at each level for categories of Bad Actors (items with poor performance indicators), and the Top 5 Highest Risk SIF’s or HIPPS (functions with the worst performance indicators). All these reports are driven by the powerful SLM Event capture capability. Every Safety Instrumented System (SIS), SIF, IPL or Device contained in the SLM database may have many Events of various types recorded against it. For example, A SIF may have Demand, Bypass, Fault/Failure and Test Events recorded for it. A Device may have Test, Fault/Failure, Maintenance, Calibration and Demand Events recorded for it.

Event Entry

 Events are entered into SLM using a guided approach that simplifies the Event Entry Process. Events are usually entered at the Function or Test Group level and the User is guided to identify any Devices associated with the Event and whether or not a failure was associated with the Function or Device. Usually data for Events that did not involve a failure are automatically entered by the system to reduce repetitive data entry tasks. SLM is also capable of accepting data from a Process Historian to automatically generate Events such as Demands, Faults/Failures, and Bypasses. The system is designed to allow Users closest to an Event to record the Event.


For example:

  • Operators may be assigned Event entry responsibilities for Demand, Fault/Failure, and Bypass Events
  • A Maintenance Technician or Supervisor may be assigned Event Entry responsibilities for Testing and Maintenance Events
  • Engineering may handle other events such as Status changes or Test Deferrals


SLM allows the User to define whether an Event requires Approval before being used in performance calculations. For Event types that require Approval, the primary and secondary Approvers for each Event Type can be independently defined at the Site or Unit levels.


Each Event record has a check box which is used to identify if an Event that had a failure was a Safety Related Failure. For example: On a test of a SIF, a shutdown valve was found not to close when it was commanded to do so. When the Test data is entered into SLM, the test on the SIF would be identified as a failed test and the Device Event for the valve would also be identified as a failed test. Both Events would be identified as being Safety Related Failures.

All of this provides the user with a continually updated view of the performance of Safety Functions at whatever granularity the user needs. Event entry provides an efficient way to assure that performance information is captured at the source. The overall result is an unprecedented level of continuous, highly efficient Safety Lifecycle monitoring.

I Like Logic Diagrams

I Like Logic Diagrams

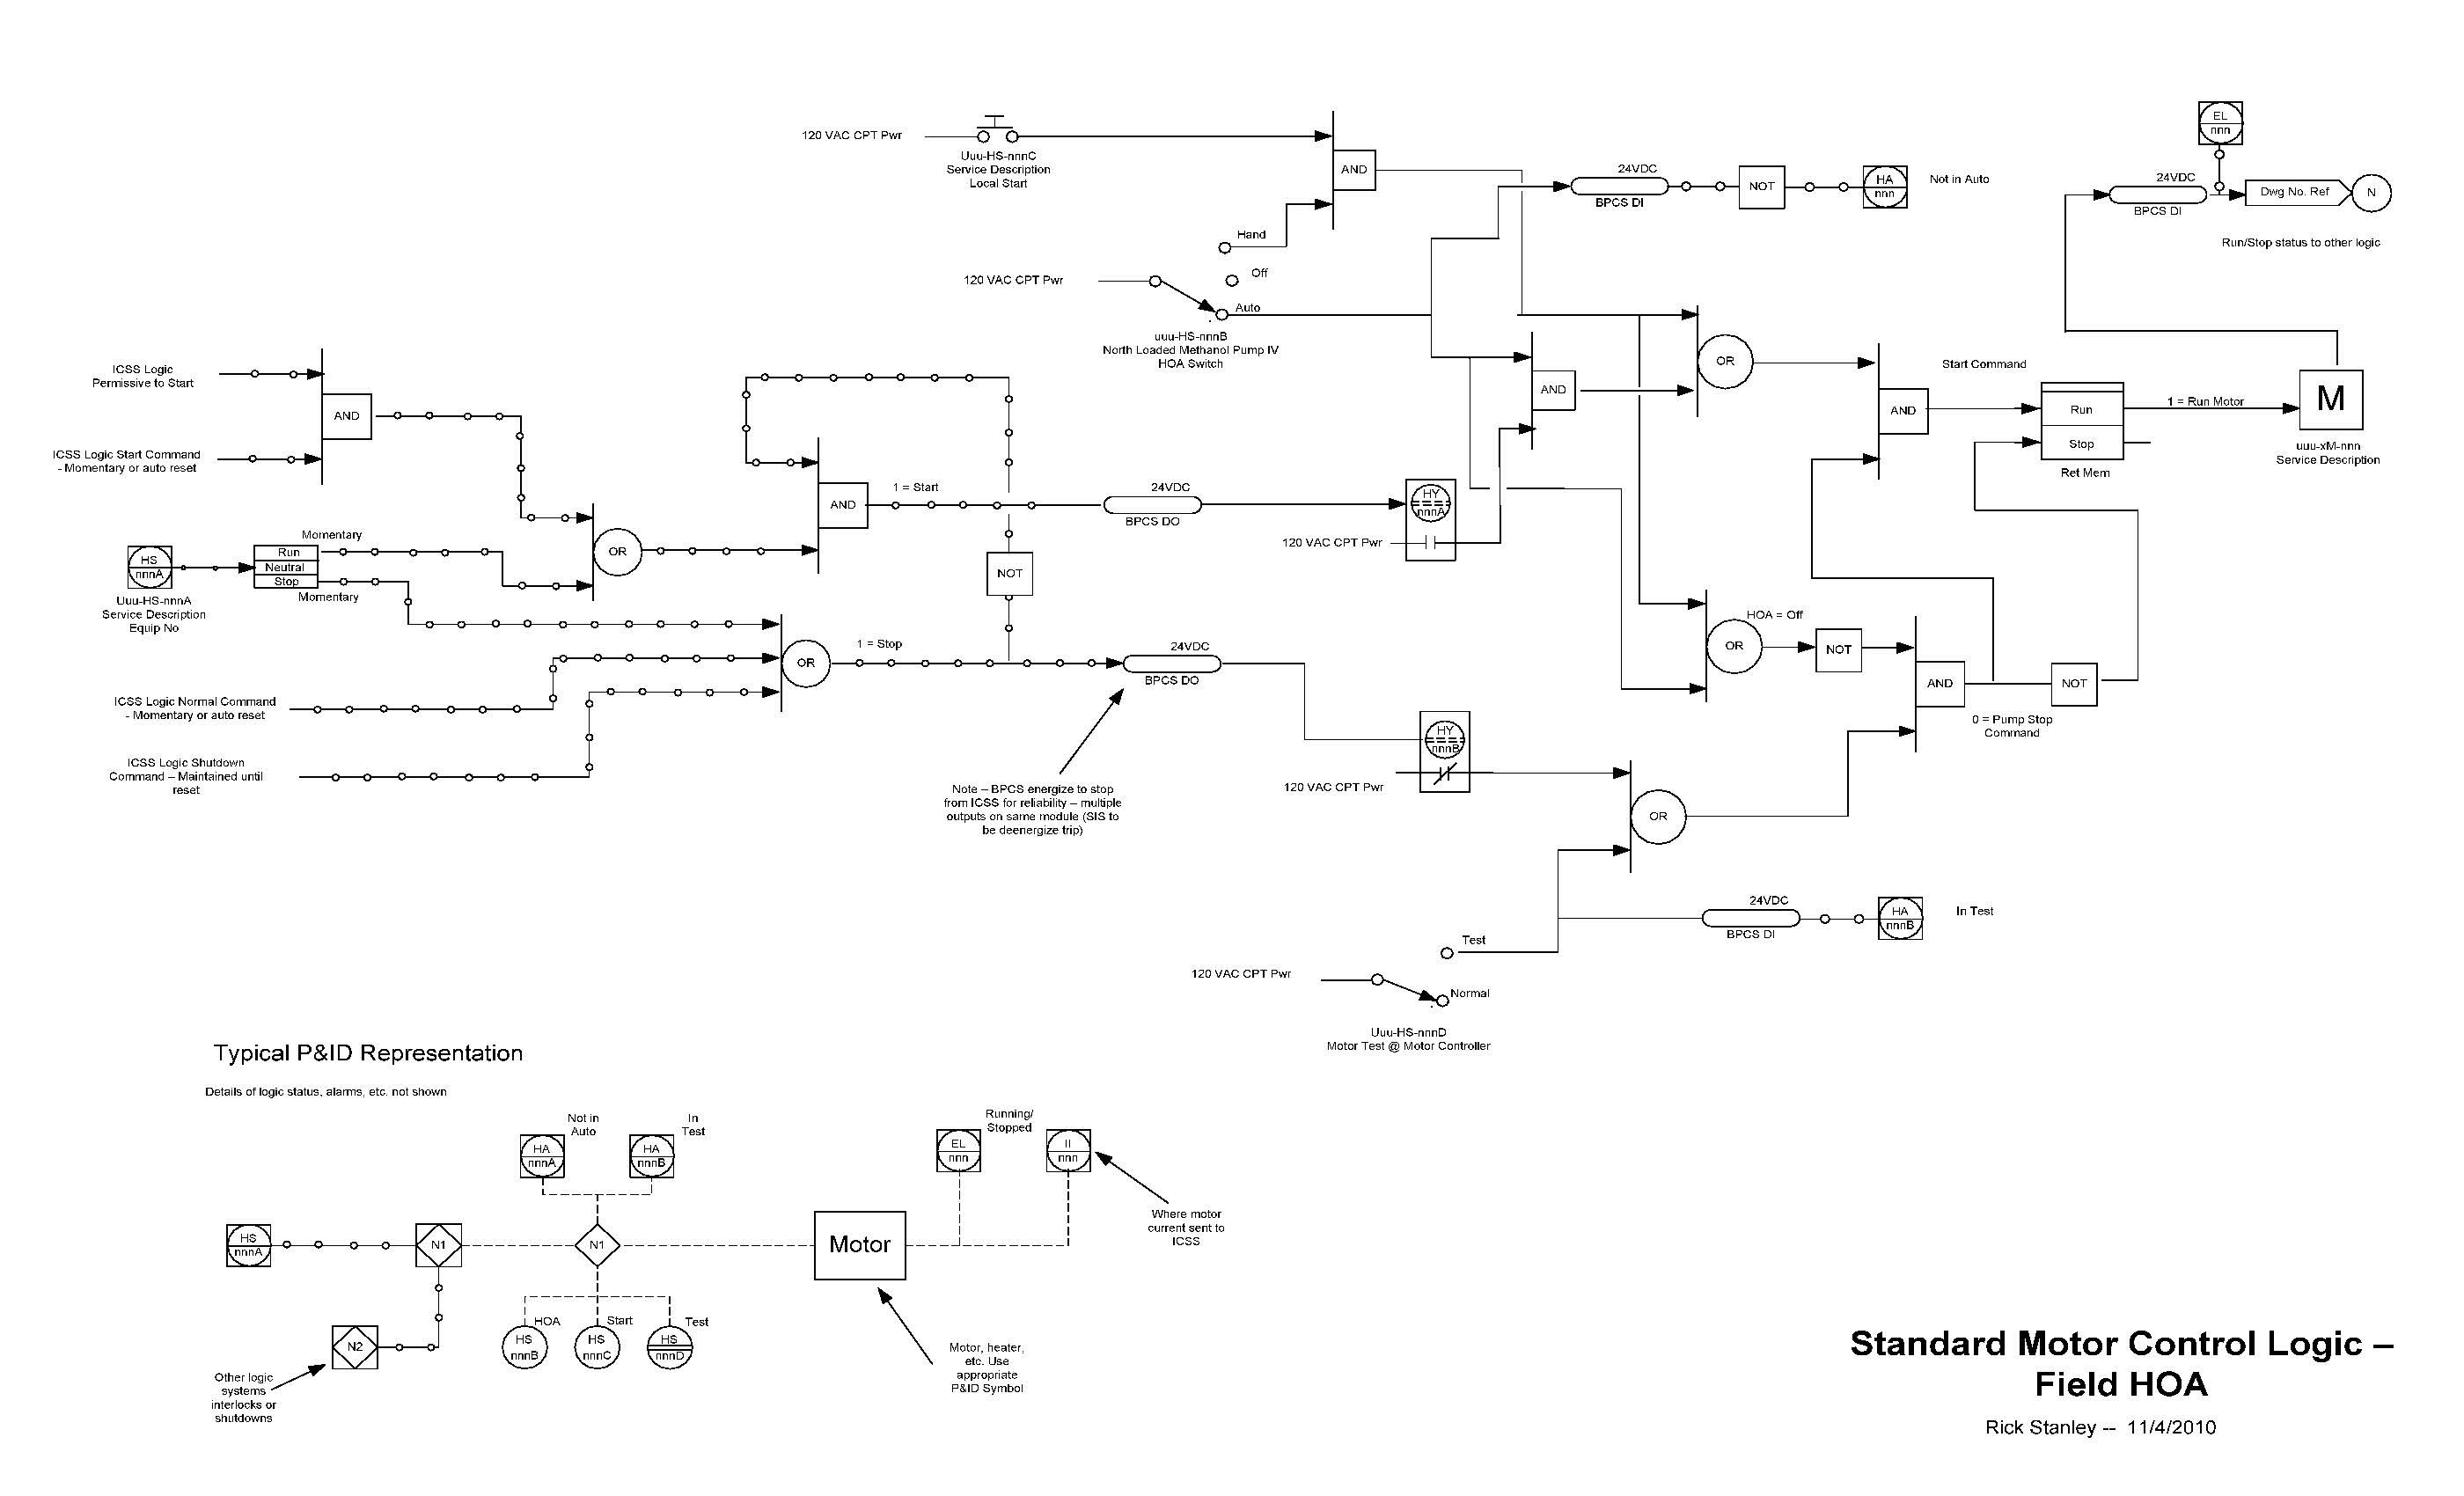
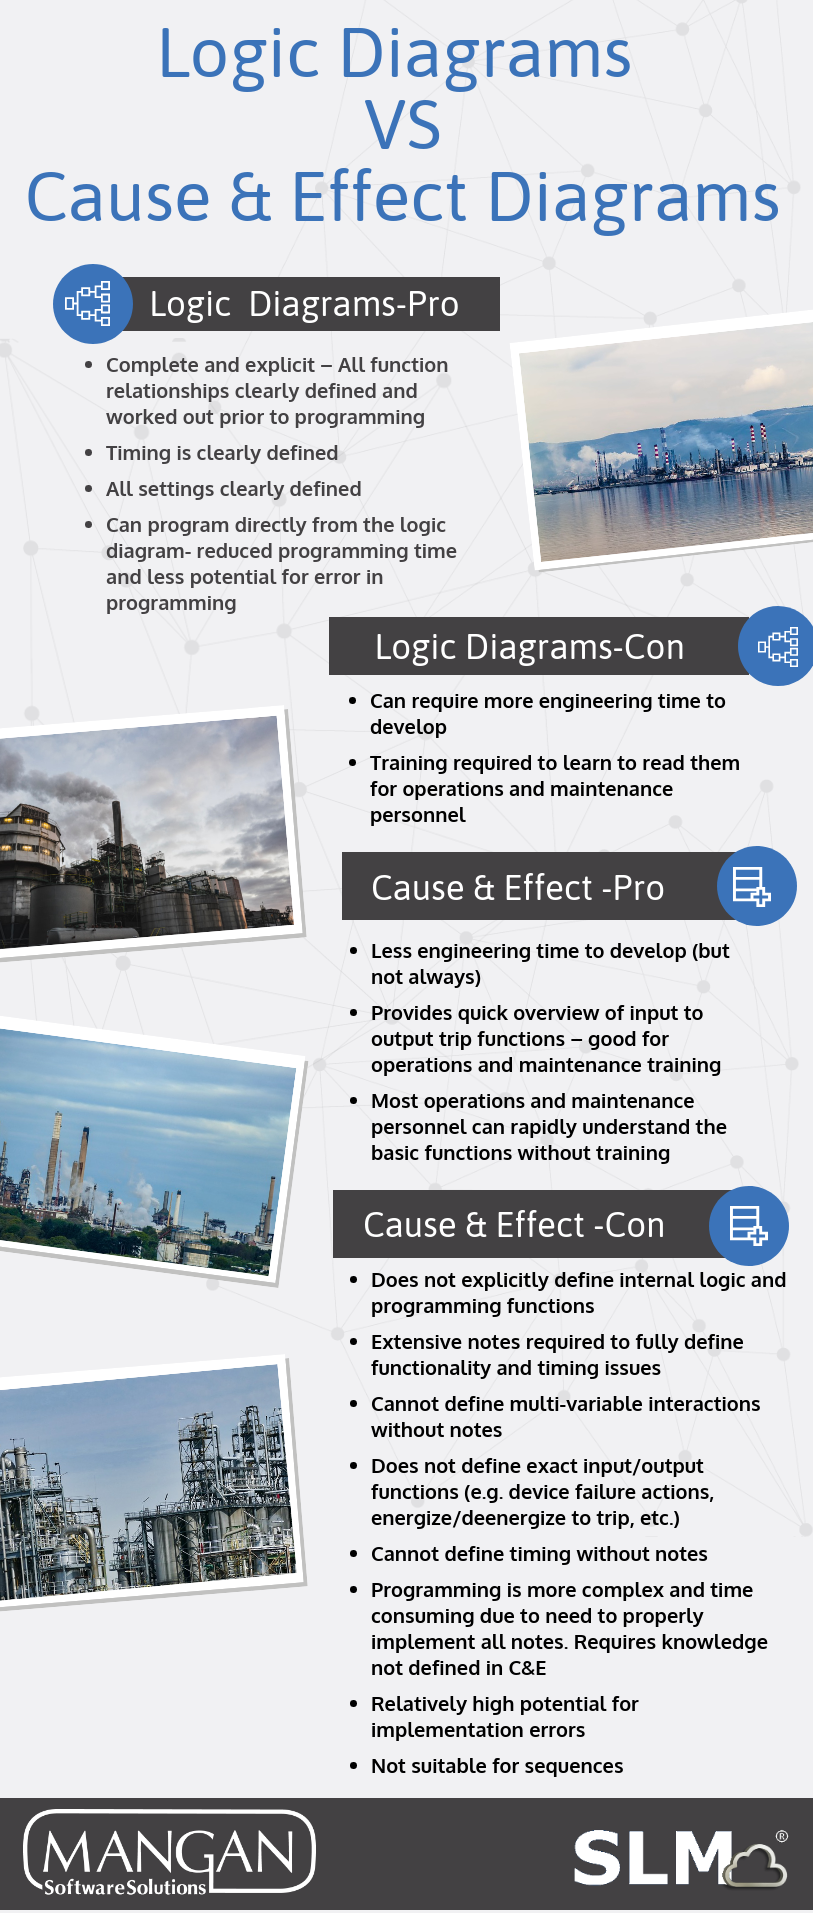
I like logic diagrams, although I’m often in the minority, to do the detailed design of a Safety Instrumented Function (SIF). Others believe that Cause and Effect (C&E) Diagrams are all that is needed. My view is that C&E’s are an effective overview tool when it comes to familiarizing people that aren’t part of the design team with a SIF’s function. However, when it comes to clearly and unambiguously defining how a SIF, or any other logic function works, I find the logic diagram to be the best tool.

C&E’s just are not very good in conveying stuff like timing or sequencing, rather they are quite confusing. C&E’s are good at saying if an input condition exists, this is the output condition. But more complex things such as timing, permissives and other things that usually exist can’t be readily defined in a C&E. Suddenly you are trying to figure out what Notes 6, 12, and 19 actually mean. Users programming from C&E’s, particularly for larger systems can easily make mistakes or misinterpret the intent. I find myself to be quite capable of misinterpreting all those notes.

I like logic diagrams because on the other hand, when done well, they are easy to interpret. The diagram symbols like those identified in a standard such as ISA 5.2 allow the user to clearly define almost everything you need. You can clearly and precisely cover set points, time delays, and complex relationships etc. Personally, I’ve used an amended version where input and outputs get more directly defined as power sources, dead bands for switches, whether the logic operates on an open or closed switch, or energizes or de-energizes a solenoid valve, etc.

Logic diagrams also can become a one to one road map for the Safety Instrumented System (SIS) programming. Most SIS programming languages have a function block option. This makes things a whole lot easier and saves a lot of time in programming, quality checking and field testing. It’s true that preparing a good logic diagram takes more time than putting together a C&E, but it’s my belief that you get your money back and then some just in simplicity and reduced errors. It’s simple to put a note on a C&E that someone might easily misunderstand, but in a logic diagram you have to sweat the details up front and not pass it on for a programmer to figure out (and everyone thereafter).

I think that logic diagrams are an investment. They take time to prepare yet start paying back at the time of programming. The real payout comes at the time of pre-startup validation. With well-reviewed logic diagrams, the potential errors in programming are pretty much beat out of the system by the time you get to checkout, loop testing, and validation. Well checked and tested systems can radically reduce startup time.

An example of what a logic diagram looks like:

A case study I cite is a process unit for which I was the lead control systems engineer. The process required over 100 distinct Interlock, sequence and SIFs as well as required over 400 logic diagrams to represent. We spent a ton of time developing the logic diagrams and a bunch more putting together test procedures and executing them.  We taught the Operators to read the logic diagrams, and during the first 6 months of operation, there was always one set or another open on a desk.

It took a lot of effort, and had real costs, when it was all said and done, we only had two logic glitches during startup (one of those was an unauthorized logic change made by a contract engineer at the last minute). The net result was that we were up and making on spec product in the first week of operation. The licensor’s startup engineers were amazed. Their feedback was that they always experienced that there would be 6 to 8 weeks of logic debugging before reliable production could be established. The extra 5 weeks of production paid for all of time we spent on logic diagrams and testing, many times over. That’s why I like logic diagrams.


Rick Stanley has over 40 years’ experience in Process Control Systems and Process Safety Systems with 32 years spent at ARCO and BP in execution of major projects, corporate standards and plant operation and maintenance. Since retiring from BP in 2011, Rick formed his company, Tehama Control Systems Consulting Services, and has consulted with Mangan Software Solutions (MSS) on the development and use of MSS’s Safety Lifecycle Management software.
Rick has a BS in Chemical Engineering from the University of California, Santa Barbara and is a registered Professional Control Systems Engineer in California and Colorado. Rick has served as a member and chairman of both the API Subcommittee for Pressure Relieving Systems and the API Subcommittee on Instrumentation and Control Systems.