
Using SLM Reports
SLM reports provide users with powerful tools for analyzing, filtering, exporting, and sharing information throughout Safety Lifecycle Manager. Reports can be accessed across modules and are designed to support decision making, compliance activities, operational reviews, and performance monitoring.
Whether users need tabular data, interactive charts, PDF summaries, or externally shared webviews, SLM reports offer multiple ways to present and distribute information.
What Are SLM Reports?
SLM reports are structured presentations of information generated from the Safety Lifecycle Manager database. They allow users to summarize, analyze, and review data in formats that support operational and management decisions.
Common uses include:
Compliance reporting
Operational reviews
Testing analysis
User activity monitoring
Management reporting
Data exports
Process safety reporting
Reports help organizations transform large volumes of data into information that is easier to understand and act upon.
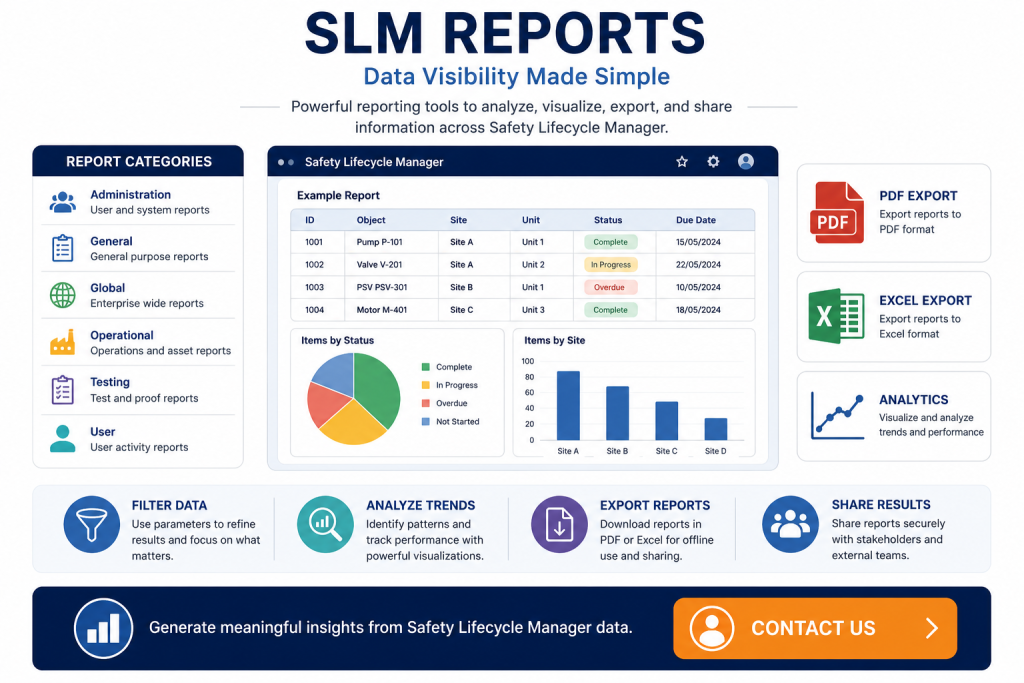
Finding Reports Across SLM Modules
Reports are available throughout Safety Lifecycle Manager and can be accessed through the left-hand navigation menu. Reports are grouped into categories to make navigation easier for users working in different areas of the system.
Typical report groupings include:
Administration
General
Global
Operational
Testing
User
Users can quickly locate reporting functions based on the type of information they need to review.
Using Parameters to Filter SLM Reports
SLM reports include parameters that allow users to refine the information returned by each report. Users can narrow results by selecting specific sites, units, dates, and other configurable options.
Available parameter types include:
Site selectors
Unit selectors
Date pickers
Checkboxes
Dropdown lists
Multi-select fields
This flexibility allows users to generate highly targeted reports without manually filtering exported data.
Organizations managing complex asset structures can use the SLM Object Tree alongside reporting features to focus reports on specific sites, units, and equipment hierarchies.
Report Formats Available in SLM
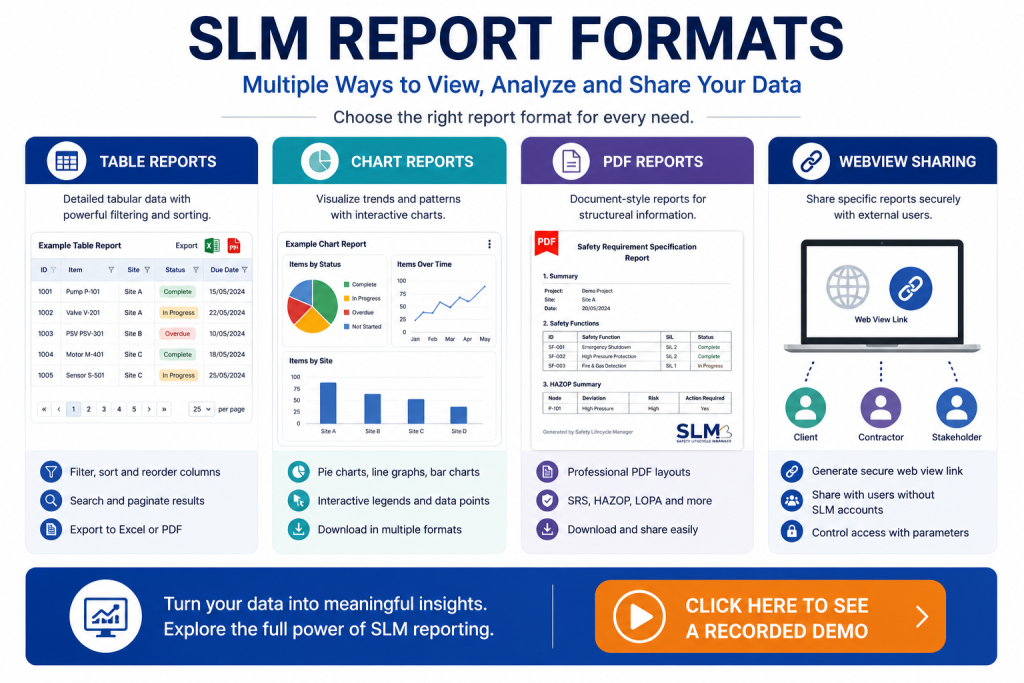
SLM provides multiple reporting formats to suit different business requirements. Users can choose between tabular reports, charts, and document-style PDF outputs depending on the information being presented.
Benefits include:
Flexible presentation options
Improved data visibility
Easier trend analysis
Better communication of results
Faster reporting workflows
Working with Report Tables
Table reports provide powerful tools for reviewing and analyzing information. Users can interact directly with report data to customize how information is displayed.
Capabilities include:
Column filtering
Sorting
Column reordering
Pagination controls
Data searching
Export functionality
Users can also generate Excel and PDF versions of many reports for offline analysis and distribution.
Visualizing Information with Charts
SLM includes chart-based reports that help users identify trends and patterns more quickly than traditional tabular views. Available chart formats include pie charts, line graphs, and bar charts.
Interactive chart functionality allows users to:
Toggle legend items
Focus on specific datasets
Explore trends visually
Download charts for presentations and reports
Charts are particularly useful for operational reviews and management reporting.
Sharing Reports Through Webviews
One of the most powerful reporting features within SLM is the ability to share reports through Webviews. Users can generate a secure link that allows specific report data to be viewed without requiring an SLM account.
This capability allows organizations to:
Share information externally
Improve stakeholder visibility
Reduce manual report distribution
Provide controlled access to report data
Support collaboration across teams.
To learn more about secure external information sharing, see Sharing Information with SLM Webviews.
Benefits of Using SLM Reports
Organizations using SLM reports gain better visibility into operational, compliance, and process safety information.
Key benefits include:
Faster access to information
Improved decision making
Better compliance visibility
Reduced manual reporting effort
Consistent reporting standards
Enhanced collaboration across teams
Guidance from the UK Health and Safety Executive emphasizes the importance of maintaining accessible and accurate process safety information throughout an asset lifecycle.
The UK Health and Safety Executive (HSE) highlights the importance of maintaining accurate operational and safety information to support effective risk management and decision making. Learn more about process safety management from HSE.
SLM-101 Using Reports
0:06
Welcome to this Application Explainer video, part of our SLM 101 topic range.
0:11
In this video, we’ll be covering the subject of using reports within SLMA.
0:15
Report within a software application is a structured presentation of data or information generated from the application’s database or other sources.
0:24
Reports are typically used to summarise, analyse and present data in a meaningful format for decision making or informational purposes.
0:33
The following information will be covered in this training.
0:36
Chapter one where are reports found in SLM?
0:40
Chapter 2 will be report parameters and Chapter 3 will be types of reports.
0:49
In chapter one we’ll be covering where can the reports be accessed in the different modules and how reports can be grouped and categorised.
0:58
Reports are accessible within any user module via the left hand panel in the software.
1:12
Reports are grouped into categories for easier navigation inside the Operate and Maintain module.
1:22
For example, you can see reports are grouped into Administration, General, Global, Operational, Testing and User.
1:36
In Chapter 2 we’ll be covering which types of reports can be generated and how do parameters play a part.
1:44
Users have the ability to filter the data retrieved by the reports using the parameters supplied to each report.
1:51
Various types of parameters are available for this purpose.
1:54
You can refine your data by utilising the report Scope drop downs which consists of a selection of sites and units.
2:03
You can either select all sites and all units or you can drill down to a specific site and choose a specific unit.
2:13
SLM also includes other parameters like drop downs, checkboxes, date pickers as well as multi selects.
2:36
In Chapter 3 we will be covering which types of report representations does SLM provide.
2:43
Tables are among the report types available through SLM.
2:48
In a report table, users have the capability to filter data using column filters, rearrange column orders, sort columns by data, or even adjust the amount of data displayed on the table using pagination.
3:22
Additionally, users can generate PDF and Excel versions of the reports.
3:42
SLM also provides another type of report known as charts which encompass various types such as pie chart, line graph and bar charts.
3:55
These charts are dynamic and the user can interact with its legend and also these reports can be downloaded in various formats.
4:30
The final type of reports are PDF reports which are designed to showcase SRS data, HAZOP and LOPA data.
4:43
In the tool section of the report, we also have a button that will create a web view.
4:48
Web views share specific elements of SLM to other users who do not have an SLM account.
4:54
In this scenario, we’re going to use the Create Web View button to generate a link that will allow us to share a specific report with specific parameters.
5:07
We copy the link, open a private window, paste the link, and now we’re able to see the report being rendered without the necessity of having an SLM account.


