Bring Back the Basics-A deeper Dive to Practical Field Instrumentation in Process Safety Service (Part 2)

Bring Back the Basics-A deeper Dive to Practical Field Instrumentation in Process Safety Service (Part 2)

Bring Back the Basics – A deeper Dive into Practical Field Instrumentation in Process Safety Service

(Blog Series Part 2)


General Requirements 

When it comes to specification of field instrumentation used for Process Safety related applications, designers are often left on their own to specify the instrumentation. SIF input and output performance may be specified in a Safety Requirements Specification, but all too often I’ve observed that these specifications are minimal or go directly to specifying a manufacturer and model number without defining what the performance requirements actually are. I’ve also observed some level of carelessness in specifying field instrumentation for Process Safety related applications. Engineers, being Engineers are often attracted to shiny things. This doesn’t really have a role in selecting field instruments for Safety Related Services. I’ve seen quite a few instances where inappropriate selections were made in pursuit of the bright and shiny.

Field instrumentation must be specified and installed so that it meets the requirements of the IPL or the SIF Safety Requirements Specification. Some of the considerations to include when selecting the field instrumentation and its installation are:

  • Ability to make the required measurements with the required accuracy and response time
  • Independence of the measurement from IPL Initiating Causes and from other IPL’s
  • Ability of final elements to execute the required Safe State actions with the required response time and performance
  • Availability of the instruments and the ability to deliver performance that meets the IPL or SRS Integrity Level requirements
  • Reliability of the instruments and their installation to deliver the SIF Spurious Trip Rate specified in the SRS.
  • Maintainability and Testability of the instruments

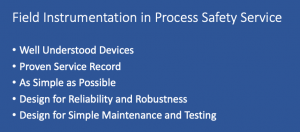
 Making the Measurement

Quality input measurements are critical to a SIF’s or other instrumented IFPL’s successful implementation. Selection of input field instruments must be reliable and provide the level of accuracy of the measurements needed to provide a well performing IPL or SIF.

Input measurement instruments should be selected based upon a User Organization’s experience with the measurement methods and the devices specified. They also only need to perform well enough to meet the requirements. Over specifying accuracy or attempting to use measurement methods that don’t have an established track record can result in poor IPL performance. This isn’t always obvious to a lot of SIS engineers or to the engineers specifying the field instrumentation. Specification of new, untried measurement techniques has gotten more than one engineer in trouble in the pursuit the new, bright and shiny. A few applications where this has resulted in problems are highlighted below

  • A Site was moving towards greater use of guided wave radar level measurements. Early experience in a few test applications had been limited, but positive. A decision was made to apply them to a retrofit of a set of reciprocating compressor protective shutdowns. The designs proved to be unreliable for shutdown applications as the measurements would frequently drop out for short periods, but which the shutdown systems saw and shut down the compressors repeatedly. Since then, guided wave instrument manufacturers have refined their designs to address the problems that were causing the instrument signals to drop out.
  • A Site was moving towards the use of vortex shedding flow meters as an alternative to traditional orifice plate and DP transmitter flow measurements. A decision was made to apply them to a process heater low feed shutdown. Further, to save the cost of multiple flow meters a two-head vortex shedder design was specified. During an FSA for the SIS, the selection of this flow meter was questioned. After some investigation it was determined that the two-headed design was a prototype for the manufacturer, and that there was no data at all on its performance. The design had not even been flow tested in the lab. The FSA report recommended that this device not be used in SIF applications.
  • A Process Licensor specified a feed gas specific gravity analyzer be used in correcting a feed flow measurement, and that the corrected value be used in the unit master shutdown. The system was installed as specified by the licensor, and within the first week of operation a spurious trip occurred due to a brief power interruption to the analyzer. It was suspected that a technician had mistakenly shut off power and then turned it back on after realizing their mistake. The shutdown system saw the dip and tripped the unit on low flow. As a result, the analyzer was taken out of the flow correction calculation.

 Some general thoughts on specification of input instrumentation

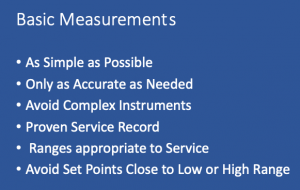
  • The SRS for SIF’s should specify functional requirements for input instrumentation such as the basic instrument type, required accuracy of the instrument and the trip point, and the measured range. The SRS should also identify the service severity of the process measurement (high temperature, high pressure, corrosive, high vibration, etc.).
  • Input instrumentation should be selected from types for which the User has significant experience and be as basic as possible. Process Safety related instrumentation is not a place to try out new stuff. Complex instrumentation, especially analyzers should be kept out of any shutdown applications. Where possible, the User should have a list of qualified instrumentation, either due to prior use experience or vetting though manufacturers service data or third party certification.
  • Input instrument ranges should be selected to provide a live measurement at normal operating conditions and have sufficient signal margin around the trip point to provide a reliable indication of a trip condition. This can be a problem in some applications such as low flow trip that uses an orifice plate and DP transmitter. There is a square relation between signal and flow, so a trip set point of 10% of the instrument’s flow range is actually only 1% of the DP transmitter signal. This is generally too low of a signal to reliably indicate a trip condition so either the trip point needs to be raised or a flow measurement method that doesn’t have this behavior should be considered.

It should be noted that many times a trip point is specified based upon maintaining a comfortable margin between normal operation and trip conditions, and that sometimes a too wide of a margin is specified. There is a balance between maximizing this margin and specifying a trip point that is too low to reliably measure.

Final Element Design

Final elements need to be carefully considered for their availability and reliability in being able to bring a process to a safe state. Shutdown valves need to be selected based upon high reliability so they should be of a design where critical parts are not overly subjected to severe process conditions.

For SIF’s the allowable leakage across closed shutdown valves needs to be specified and needs to recognize the realities of how valves behave in real services. Those with operational experience know that no leakage specification survives the first day in process service.

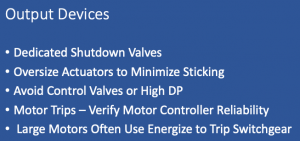
Dedicated shutdown valves with open flow paths and whose critical seating surfaces are protected during the 99.99% of the time the valve is open should be considered. Standard control valve designs typically should not be used where plugs and seats may be subjected to process wear and high pressure drop. Sharing of control valves in shutdown designs is often considered in order to save the cost of a trip valve but in my view doing so to avoid an extra trip valve is usually false economy

Stroking speed needs to be carefully considered and oversized actuators that can break any sticking forces that develop over time are not a bad idea. Actuator designs should be fail-safe and use of double acting actuators or motor actuators should be avoided. Where non fail-safe actuator designs are used, the loss of motive power such as air supply or motor power must be included in PFD calculations and the motive power sources fall under the testing and MOC requirements for SIF’s.

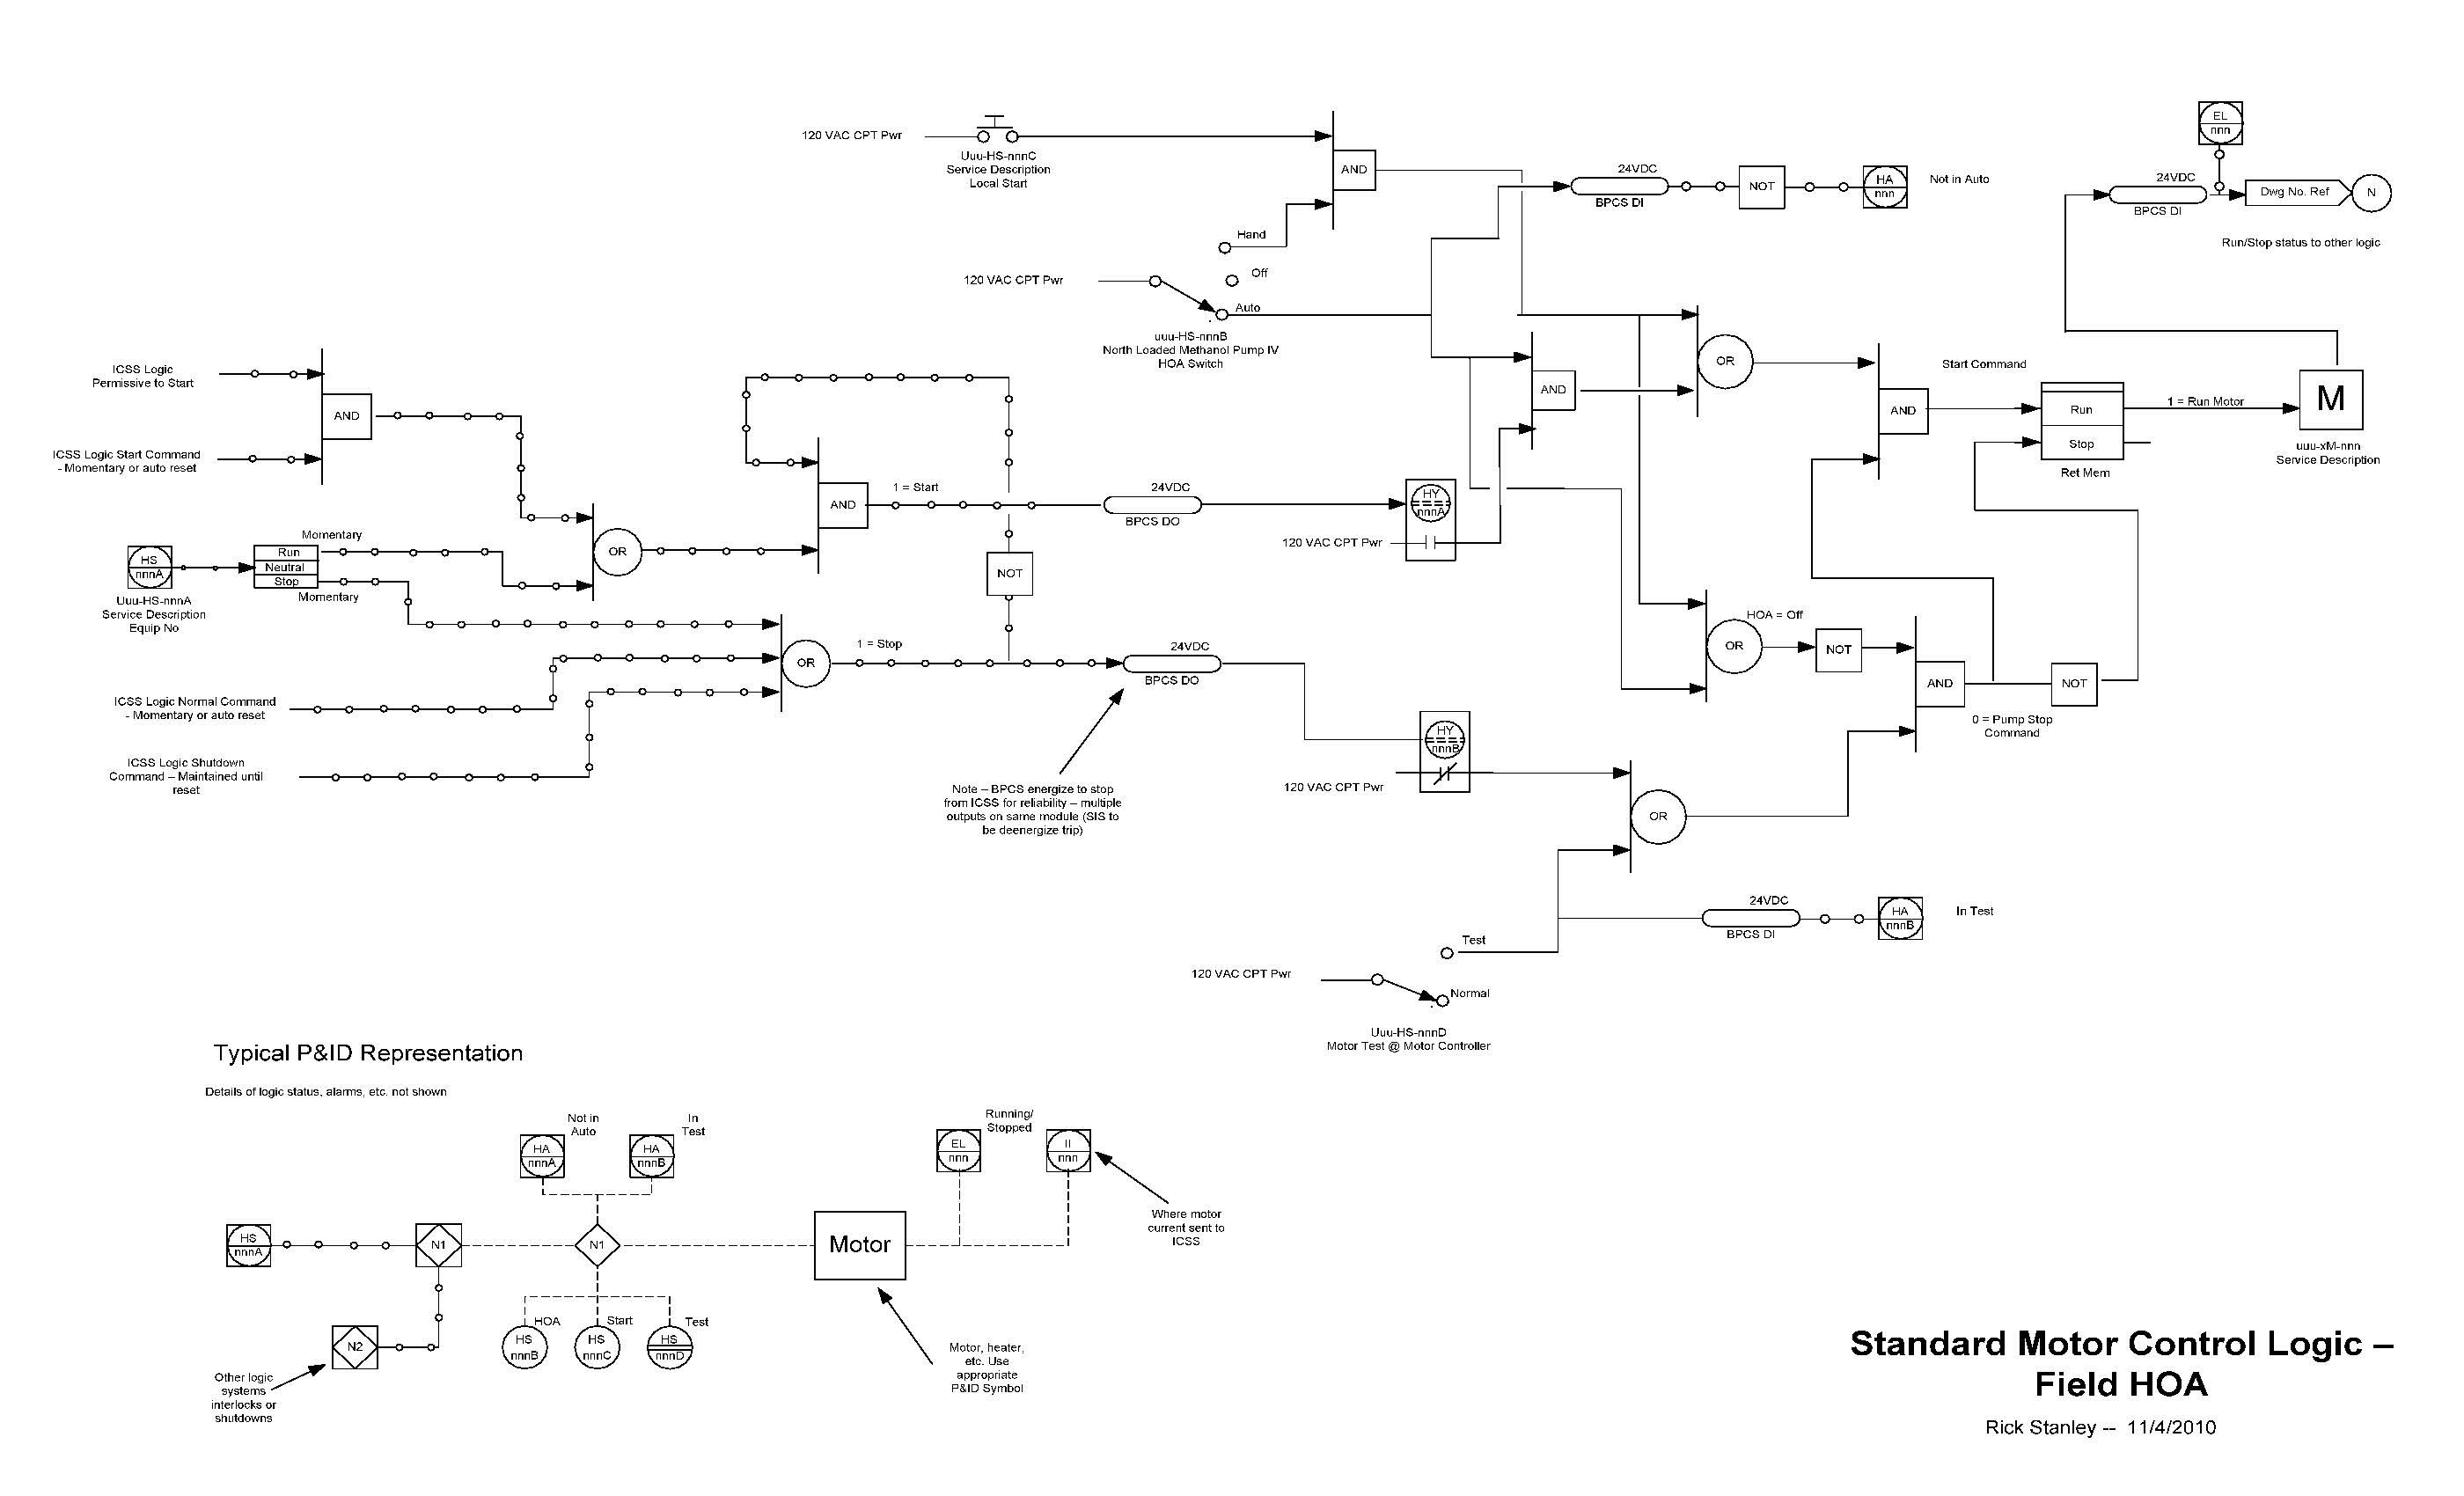
Most shutdown valves use a solenoid valve to vent air off the actuator. Single solenoid valves are subject to spurious trips should a coil burn out or a circuit problem occur. A common application is to use 2oo2 solenoid valves for shutdown valve services. This provides high reliability and allows for frequent online testing. Some of the original home-grown designs with which I was involved were fairly expensive to implement but justified considering the costs of spurious trips. Since then commercial packages with full diagnostic and testing functionalities are now readily available on the market.

Shutdown services may include shutting down of motor driven equipment. Usually a SIF or Interlock that shuts down a motor uses 1 or 2oo2 interposing relays, but often the designer doesn’t consider the reliability of the motor starter itself. This is a particular issue with high voltage, high power motors that use full blown switchgear to operate the motor. These applications usually have an energize to trip motor trip coil, so the performance of this SIF is often dominated by the availability of switchgear power. When a energize to trip motor controller is used, the power systems for that system now fall under the testing and MOC requirements that apply to any SIF.

Independence

The design needs to be independent from other IPL’s or from the IPL’s Initiating Causes. For example, a high-pressure alarm that warns of failure of a pressure control loop requires its own pressure transmitter and process connection.

Instruments associated with a SIF should not share services with BPCS functions, although some organizations allow for minimal sharing, such as allowing one of three transmitters in a 2oo3 voting scheme to share inputs with a BPCS loop. This requires some special attention as now there are two functions involved when maintaining or testing the field instrumentation. In these designs, the transmitter should directly drive SIS inputs using SIS power. The input to the BPCS should be taken from an isolator that will not affect the SIS loop performance if the BPCS circuit is broken

Reliability

While HAZOP’s and LOPA’s concentrate on the required availability of protective functions, in most real plants, reliability is every bit as important. IEC 61511 says almost nothing about reliability and leaves it to the User to figure it out. A key part of specification of any protective function is determining the effect of spurious trips upon a process unit. A spurious trip introduces both process safety risks and commercial risks. It is an adage in the process industries that the highest risk periods are during a unit startup or shutdown. When a unit experiences a spurious trip, the lost production while the unit is secured and restarted, even if no damage has occurred, can be significant. Some processes can take days to restart, and loss of production is measured in the hundreds of thousands to millions of dollars. When an SRS is prepared for SIF’s, the costs and safety risks associated with spurious trips should be identified and specific reliability requirements included.

Process Safety risks are even more of an issue when the shutdown is a crash induced by a protective system’s spurious trip. When a unit is crashed, all sorts of bad things can happen. Hot joints that cool down too quickly can leak or even cause significant loss of containment. Equipment can also be damaged. Some process types are especially intolerant of unit crashes, such of Fluid Catalytic Crackers. A sudden shutdown can result in damage to refractory damage or plugging systems with catalyst or heavy oil. It’s bad enough that an FCC may take days to restart, but if refractory damage occurs, that interruption can spread to weeks and the repair costs can be significant.

The net result is that the costs associated with spurious trips can justify a lot of reliability features in field instrument design. The most common method is the use of voting logic that tolerates a level of faults in the field instrument. Schemes such as 2oo3 or 2oo2d can provide high availability and are tolerant of failures in field instrumentation. I’ve seen places where it was decided to not provide robustness in order to save a transmitter or reduce SIS programming. Those kinds of decisions are usually false economies. Usually the cost of adding robustness to a trip function is covered in the first few minutes after a false trip occurs.

Another aspect of selection of instrumentation for Process Safety Services is to avoid the use of switches. At one time process switches such as float levels, pressure and DP switches, etc. were very common. Their long service history has demonstrated their unreliability. A process switch sits dormant for extended periods and there is no way other than frequent testing to verify whether a process switch is operable or not. As a result of the many improvements made in continuous process measurements and of programmable logic solvers, the justification to use what were perceived as cheaper instruments has become moot. Almost every current standard or recommended practice discourages, or even forbids the use of process switches in Process Safety Services.

Spurious trips can also be significantly reduced by selecting the proper field instrumentation. As discussed above, the field instruments should be a simple and robust as possible. Where an orifice plate and DP transmitter will do, it’s far preferable to use these relatively simple and tried design vs. a complex flow transmitter that may experience signal drop-outs or failure modes that are not well understood.

Accuracy is another area where instrumentation in shutdown services gets over specified. The basis for the specification of a trip point in a SIF or Interlock needs to be clearly understood when field instrumentation is being specified. If the trip point is specified to protect against a specific equipment limit, high accuracy may be required. But if the trip point is needed only to detect when a process has had a failure that can result in hazards, such as a low flow caused by the failure of a pump or compressor, the trip point may be specified only to provide a comfortable operating margin. In these cases, accuracy may not be such a big deal. Attempting to provide highly accurate field instrumentation in a situation where that accuracy isn’t needed can result in designs that are not as reliable as they should be.

Maintain and Test 

All field instrumentation in Process Safety Services needs to be periodically tested. The frequency of testing is based upon the failure rates of the types of devices being used and the performance requirements of the service. Intervals can vary from quarterly to several years apart. In many instances, the test interval is more frequent than the Unit turnaround or outage frequency and provisions must be made for testing while the Unit is in operation.

 Testing provisions can take a number of forms, including

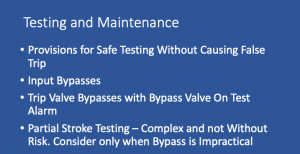
  • Provisions for bypassing of Input signals within the Safety Function logic
  • Provisions for bypassing of commands to final devices
  • Provisions for bypassing of final devices themselves
  • Other on-stream testing provisions such as partial stroke testing

My preference has always been to design testing systems so that the final elements such as valves or motor starters can be bypassed for testing, and that the SIS logic includes detection of when a system is properly isolated and safe for testing. This isolates the trip functions from the inputs and allows for full testing from end to end without running the risk of false trips. Motor starters are difficult to test as generally they can’t be tested without shutting down the motor. Fortunately, the failure rates of motor controllers are low relative to other devices and seldom does the motor controller (other than power for energize to trip switch gear) factor into test interval calculations. However, testing of motor starters at every unit shutdown should be part of any testing program.

Voting systems are usually used in SIF services to provide both availability and reliability. Voting systems can also simplify maintenance of field instrumentation while the SIF and its process are in service. My preference has always been to use 2oo3 voting on inputs, with degradation to 2oo2 during the periods when one of the input instruments has failed. The 2oo3 scheme allows for one instrument to fail and allows one instrument to be removed from service for maintenance with minimum risk of a spurious trip occurring. The fall back to 2oo2d tends to protect against maintenance errors that might take out a second transmitter. In any event, detailed procedures for working on Safety Related instrumentation should be developed during their design.

I also prefer that physical bypass piping and a bypass valve be used with trip valves. In most installations the cost is nominal compared to the costs of a false trip caused during testing. The bypass valve should be equipped with position indication that allows the logic solver to verify that the valves are in bypass before allowing testing to proceed, and which provides an alarm whenever the bypass valve is not fully closed.

Many valve manufacturers offer functionality to support partial stroke testing during ongoing operations. This function results in the valve being commanded to move to some partially closed position, typically 10 to 20% of stroke (90 to 80% open) and then return to a full open position. This hasn’t been a real attractive alternative for me. It complicates the installation, often requiring an expensive smart valve positioner to facilitate the testing in addition to trip solenoid valves. Partial stroke testing also makes life harder for instrument technicians who require special training to partial stroke tests. Newer designs do allow for partial stroke tests to be automatically scheduled and executed, which reduces the probabilities of human error.

There are installations where partial stroke testing is justified, such as a requirement for very frequent testing or for large or very high-pressure valves where installation of a bypass for testing is impractical or just too expensive (that high-pressure piping takes up a lot of space). Some organizations have embraced partial stroke testing, but his requires commitment to fully understanding how these functions work and owning and using the additional software required to set up stroke testing and analyze the results.

Conclusions

The performance and reliability of field instrumentation is critical to the safe performance Process Safety Protective Functions. Proper and complete performance requirements need to be clearly defined in documents such as Safety Requirements Specifications. This includes specification of all set points and the basis for the selection of those set points.

The selection of field instrumentation should be based upon proven performance and well-known characteristics and failure mechanisms. The designs must include provisions for maintenance and testing over the life cycle of the instrumentation. Overall designs should be simple as possible but include provisions for high reliability and simple and safe maintenance and testing. Overly complex selections, or systems not designed for high reliability typically result in poor performance, excessive spurious trips and the accompanying high costs of operation and overall reduced safety of operation.


Rick Stanley has over 40 years’ experience in Process Control Systems and Process Safety Systems with 32 years spent at ARCO and BP in execution of major projects, corporate standards and plant operation and maintenance. Since retiring from BP in 2011, Rick formed his company, Tehama Control Systems Consulting Services, and has consulted with Mangan Software Solutions (MSS) on the development and use of MSS’s Safety Lifecycle Management software.

Rick has a BS in Chemical Engineering from the University of California, Santa Barbara and is a registered Professional Control Systems Engineer in California and Colorado. Rick has served as a member and chairman of both the API Subcommittee for Pressure Relieving Systems and the API Subcommittee on Instrumentation and Control Systems.

Bring Back the Basics – Practical Field Instrumentation in Process Safety Service (Blog Series: Part 1)

Bring Back the Basics – Practical Field Instrumentation in Process Safety Service (Blog Series: Part 1)

Bring Back the Basics- Practical Field Instrumentation in Process Safety Service

(Blog Series Part 1) 

The selection of field instrumentation in Process Safety Service can make or break the performance of safety instrumented functions. Poor selection and design can result in unreliable and costly failures and unscheduled shutdowns. In some processes, an unscheduled shutdown can cost millions of dollars as well as expose operating personnel and the community to hazards associated with equipment failure or damage caused by uncontrolled shutdowns. This discussion is directed towards the more practical aspects of specifying and owning field instrumentation that is used in IPL services such as Alarm, BPCS functions and Safety Instrumented System (SIS) Safety Instrumented Functions (SIFs).   

Get a demo of Safety Lifecycle Manager  

The Safety Lifecycle for Process Safety applications runs from the initial conceptual designs for a process unit throughout its life to decommissioning. 

  • The first part of the Safety Lifecycle involves the Hazards Analysis that identifies the need for specific Protective Functions that act as Independent Protection Layers (IPLs). Most of these are instrumented functions that have specified availability requirements. 
  • The second part of the Safety Lifecycle is the detailed specification and design of the field instrumentation sensors and final elements that implement the IPL functions.
  • The third part, and longest duration, of the Safety Life Cycle is the ownership phase where the devices selected are operated, maintained and tested over the life of a process.


 Click here to Read Part 2 of this blog series: 

Rick Stanley has over 40 years’ experience in Process Control Systems and Process Safety Systems with 32 years spent at ARCO and BP in execution of major projects, corporate standards and plant operation and maintenance. Since retiring from BP in 2011, Rick formed his company, Tehama Control Systems Consulting Services, and has consulted with Mangan Software Solutions (MSS) on the development and use of MSS’s Safety Lifecycle Management software.

Rick has a BS in Chemical Engineering from the University of California, Santa Barbara and is a registered Professional Control Systems Engineer in California and Colorado. Rick has served as a member and chairman of both the API Subcommittee for Pressure Relieving Systems and the API Subcommittee on Instrumentation and Control Systems.


Process Safety Data for Pressure Relief Systems

Process Safety Data for Pressure Relief Systems

Process Safety Data for Pressure Relief Systems

Pressure Relief Systems have been around a long time, but the documentation of their Process Safety Data has a pretty tortured past. Due to the relatively long history, dating back to the early boilers in locomotives and steamboats, there are lots of regulations that grew a bit haphazardly in response to early incidents.

Most States in the US have regulations for pressure relief devices, however those regulations are all over the place in defining Process Safety Data requirements. Some are focused on Relief Device Inspection, Testing and Repair while others attempt to address other aspects of Pressure Relief System Process Safety Data. Some states hardly address Pressure Relief Systems, while others have provisions that focus on single applications in great detail. Some cities have their own rules independent of State rules.

The National Board of Boiler and Pressure Vessel Inspections has published a summary of the various US and Canada regulations. These regulations are inconsistent from jurisdiction to jurisdiction, are usually incomplete, and often are well out of date.

 Click here to review The National Board Synopsis

 While most jurisdictions address basics such as identifying ASME Section I and Section VIII Code (often an obsolete, dated version and not the current version), they generally address only a few of the things an owner should be doing to properly administrate the design, installation, operation and maintenance of Pressure Relief Systems. They can focus on the oddest aspects of relief systems and not address other critical requirements. This can result in organizations deciding they only have to comply with a few requirements, when really, they should be doing much more. 

The overall structure of a robust Pressure Relief System Process Safety Data program is illustrated in the figure below. Each of these items is described in the sections below.

 Pressure Relief System Definition

The first consideration in maintaining Process Safety Information is to have a definition of the scope of a Pressure Relief System. A single Pressure Relief System consists of one or more pressure relief devices, the equipment and piping that the Pressure Relief System protects, and any other relevant equipment such as block valves or supplemental devices. Some jurisdictions require this to be clearly documented but others do not specifically address this requirement.

The Process Safety Information for a Pressure Relief System should include material that clearly defines the scope and boundaries of each System. This may take the form of a sketch that shows all relevant equipment, piping and pressure relief devices or a list that contains the same information.

However, an issue with sketches or lists is that it can be difficult to verify that all equipment in a facility is adequately protected from over pressure. The sketches and lists can effectively document what is protected, but it is a much more difficult task to find what may have been left out. Ideally, a database that allows linking of Pressure Relief System definition to a complete equipment data base should be used. Query of this database can rapidly identify equipment that may not have over pressure protection.

Process Sizing Basis

When a Pressure Relief System is designed, a large number of potential Pressure Relief System sizing scenarios, usually based upon the descriptions contained in API RP-521, are evaluated by a Process Engineering group. The case that requires the largest pressure relieving device sizes is recorded as the sizing case. This is the process data that makes it to the pressure relief device data sheets. The full process analysis often then goes into a box that gets sent to the owner with all of the other design documentation. Often this box goes into long term storage somewhere and is seldom seen again.

Processing facilities are dynamic things, and modifications and improvements often affect the required pressure relief capacity. If the original Relief System sizing calculations are stored in an inaccessible box, every change requires a full re-evaluation of the Pressure Relief System from scratch. This is something that becomes prohibitive and the required evaluations often don’t get done, are highly inefficient, or are inconsistent with the initial evaluations.

Pressure Relief System sizing evaluations and calculations for all of the pressure relief causes should be retained in records that are readily available when the Pressure Relief System needs to be re-evaluated. These can take the form of paper records or scanned records stored digitally, but the key point is that a complete, progressive and up to date set of Pressure Relief System sizing evaluations and calculations needs to be kept in a format and location that allows for efficient recall, review and update.

Relief Device Specifications

The physical specifications for Pressure Relief Devices are typically contained on data sheets used to purchase the devices. These sheets contain physical requirements such as manufacturer, model number, materials of construction, body and process connection ratings, required relief area and the process conditions for the relief device sizing case. Often these data sheets are the only Pressure Relief Process Safety data that is readily available to a Site’s staff and are often erroneously considered to be full documentation.

What is often not appreciated, is that the information contained on a Pressure Relief Device data sheet is only a subset of the full information required to own and maintain the Pressure Relief Devices. These data sheets are used as tool for procurement and contain only the information needed to procure a specific device. They are an integral part of the Relief System Process Safety data, but only a small part. In addition to the Pressure Relief System evaluation records described above, a complete set of manufacturer’s manuals need to be available to identify key parts and dimension tolerances.

Relief Device Installation

The proper functioning of Pressure Relief Devices requires that they be properly installed, and the systems around them such as inlet and output piping, block valves and other support devices be properly designed. For example:

Section VIII spring opposed pressure relief valves have rather narrow requirements for the dynamic inlet losses (the 3% rule) and have similar requirements for both static and dynamic back pressures. Inlet and outlet block valves also have size and design restrictions, such as requirements that all block valves be at least full ported valves that do not restrict flow to the pressure relief device. There are also specific limitations of the static and dynamic piping loads that can be imposed upon pressure relief device bodies.

The Process Safety Data for a Pressure Relief System should include full installation specifications and support calculations. Support calculations should include inlet and output pressure losses and imposed back pressures and piping load calculations, including both relieving and non-relieving conditions. These calculations should be kept in a readily accessible format and locations similar to the requirements for Process Sizing evaluations and calculations.

Associated Relief System Equipment

The design of a pressure relief system dependent upon the capacity of other equipment requires that certain equipment be in service at all times the pressure relief system may have a demand placed upon it.  This equipment and other functions must be identified. Some examples are:

  • The capacity of process equipment such as fired heater duties, pump impeller sizes, etc.
  • Relief systems subject to fire cases require that the assumed vessel insulation is in place and of a design that can withstand external fire
  • HIPPS or other equipment installed to reduce the required relief load are in service
  • Block valve locks and required block valve positions

Pressure Relief System Procedures

Any Pressure Relief System Process Safety Data system includes the procedures required to safely operate the systems. This includes items such as:

  • Safe Operating Limits within which the Pressure Relief System is properly sized
  • Lock Lists and Lock/Car Seal status
  • Permissible line-ups for system with multiple relief devices and installed spares
  • Other operating restrictions required to safety operate the Pressure Relief System

Relief Device Inspection, Testing and Maintenance

Almost all jurisdictions require that Pressure Relief Devices be inspected, tested and repaired at regular intervals, and that the results of these activities be kept in a progressive record. The National Board of Boiler and Pressure Vessel Inspectors VR stamp program defines a set of minimum qualifications, procedures and documentation for the inspection, testing and repair of pressure relief devices. Some jurisdictions make it mandatory that any organization doing inspection, testing and repair of pressure relief devices hold a VR stamp. Other jurisdictions may have other requirements. In any event, a pressure relief system management program should include a robust device inspection, testing and repair program including complete documentation of all events associated with the Pressure Relief System and its devices.

Management of Change

All Pressure Relief Systems are subject to Management of Change procedures whenever modifications are made to process equipment or to the Relief System components. Often de-bottlenecking projects will increase equipment capacity, which then can impact the sizing criteria for the Pressure Relief Systems. Modifications to the pressure relief devices can also affect pressure relief system performance or affect the physical installation of the devices and their associated piping and equipment. Even apparently small changes such as modifying a pump impeller or vessel insulation can result in an improperly sized Pressure Relief System. Therefore, it is imperative that whenever a change is made to a process that its effect on Pressure Relief System design be fully evaluated and the required changes to the Pressure Relief System also be implemented and documented.


Rick Stanley has over 40 years’ experience in Process Control Systems and Process Safety Systems with 32 years spent at ARCO and BP in execution of major projects, corporate standards and plant operation and maintenance. Since retiring from BP in 2011, Rick formed his company, Tehama Control Systems Consulting Services, and has consulted with Mangan Software Solutions (MSS) on the development and use of MSS’s Safety Lifecycle Management software.

Rick has a BS in Chemical Engineering from the University of California, Santa Barbara and is a registered Professional Control Systems Engineer in California and Colorado. Rick has served as a member and chairman of both the API Subcommittee for Pressure Relieving Systems and the API Subcommittee on Instrumentation and Control Systems.

How Accurate Are Safety Calculations

How Accurate Are Safety Calculations

How accurate are safety calculations: If you have ever sat in a LOPA, inevitably there is someone that questions the accuracy of one factor or another. Usually they are trying to justify making an initiating cause less frequent or take more credit for an Independent Protection Layer (IPL).

As unsatisfying as it is, assessment of Process Safety Systems is a statistical adventure. And when you get down to it, people just don’t like, or understand statistics. They find it a playground in which to argue that their number is the “right” number. Statistics are real, but people don’t like to believe them. Otherwise casinos would not be in business.

Evaluation of protective function performance requirements and performance of the designs for those functions requires establishment of probabilities for things like how often an initiating event may occur and how effective mitigating functions are likely to be. Deciding what probabilities to use is the hard part. The problem when it comes to Process Safety Systems is that these probabilities are very fuzzy numbers. How accurate are safety calculations, unlike a pair of dice, which have very precisely defined odds of 7 or snake eyes coming up, real process related risk and failure data is less than precise.

The Process Safety Standards and Practices used by the Process Industries have developed over the past 20-30 years and the various factors used in Process Safety analysis have tended to converge on consensus values. The AIChE CCPS publication, Layers of Protection Analysis, provides a fairly complete set of values for LOPA related factors, and various publications on Safety Instrumented Systems provide representative failure rates for commonly used devices. In these instances, the publications note that the factors actually used are up to the User.

One of the things these publications generally state, is that absent any hard data supporting another value, all of the factors used should be no more accurate than a power of 10. So, factors used are values of 10, 100, 1000, or their inverse (10-1, 10-2, etc). Attempting to use any values that have more precision is usually an exercise in self-delusion. Even the factor of 10 practice is only an approximation. However, the recommend values in reputable publications are based upon the collective experience and judgement of some very experienced and pragmatic people. Unless you have lots of actual in-service data, you don’t really know anything better. Use the expert’s numbers.

When working with input data that only has a precision of powers of 10, you also have to be cognizant that the answer you get after stringing a bunch of them together in a Risk Reduction or PFD calculation, isn’t going to be any more precise than the input data. So that RRF calculation that tells you need a SIF with an RRF of 186 is giving you a false sense of precision. It’s not actually 186, it could be 100 or could be 1000.

This is why ISA 84 ed.2 and IEC 61511 only recognize Safety Integrity Levels (SIL) specified in decades – RRF’s 10, 100, and 1000.   When you are calculating a PFD of a SIF design, that 186 is often used as a hard requirement, when in reality it is a very, very fuzzy target. There is absolutely no basis to say that that a calculated SIF RRF of 130 doesn’t meet the requirements of a LOPA target RRF of 186. Given the accuracy of the input values used, 130 and 186 are the same number.

This doesn’t say that a practice of requiring a SIF design to meet a higher (but not precise) target is wrong.  It does give a design target and tends to result in more thought about the SIF designs. However, you shouldn’t fool yourself into thinking that you are being very precise. If it’s a major expense to get a SIF from 130 to 186, think about whether that really is making a difference.


 Want to learn more about  SLM®?

Click here to download the free white paper!

Slminfo
Rick Stanley has over 40 years’ experience in Process Control Systems and Process Safety Systems with 32 years spent at ARCO and BP in execution of major projects, corporate standards and plant operation and maintenance. Since retiring from BP in 2011, Rick formed his company, Tehama Control Systems Consulting Services, and has consulted with Mangan Software Solutions (MSS) on the development and use of MSS’s Safety Lifecycle Management software.

Rick has a BS in Chemical Engineering from the University of California, Santa Barbara and is a registered Professional Control Systems Engineer in California and Colorado. Rick has served as a member and chairman of both the API Subcommittee for Pressure Relieving Systems and the API Subcommittee on Instrumentation and Control Systems.

Assessing SIF and IPL Performance using SLM

Assessing SIF and IPL Performance using SLM

Assessing SIF and IPL Performance using SLM 84.01.00 and IEC 61511 Part 1, require that the performance of Safety Functions be assessed at regular intervals. The Operate-Maintain Module in Mangan Software Services’ SLM application can provide the user with real time performance data through availability and Probability of Failure on Demand (PFD) calculations performed on a daily basis. This eliminates the need to manually pull records periodically (or spend excessive time hunting, and perhaps not even finding them) and calculate performance.

Performance data is presented in reports Assessing SIF and IPL Performance using SLM displays at the Enterprise, Site, Unit and Function levels.

  • At the Enterprise Level, data is rolled up by Site
  • At the Site Level, data is rolled up by Unit
  • At the Unit Level, data is rolled up by the SIF or IPL Function

Why use Views and Reports?

 They allow users to easily monitor and identify trends such as unusually good or poor performance in a Unit or Site and bore down to the bad actors. The API Tier 3 Management View/Report provides a summary of Independent Protective Layer (IPL) performance by IPL type using values calculated from Events. Values such as Demand Rates, Failure Rates on Demand or Test, Overdue or upcoming tests, and the overall availability of SIF and IPL’s are presented. SLM also provides performance reports at each level for categories of Bad Actors (items with poor performance indicators), and the Top 5 Highest Risk SIF’s or HIPPS (functions with the worst performance indicators). All these reports are driven by the powerful SLM Event capture capability. Every Safety Instrumented System (SIS), SIF, IPL or Device contained in the SLM database may have many Events of various types recorded against it. For example, A SIF may have Demand, Bypass, Fault/Failure and Test Events recorded for it. A Device may have Test, Fault/Failure, Maintenance, Calibration and Demand Events recorded for it.

Event Entry

 Events are entered into SLM using a guided approach that simplifies the Event Entry Process. Events are usually entered at the Function or Test Group level and the User is guided to identify any Devices associated with the Event and whether or not a failure was associated with the Function or Device. Usually data for Events that did not involve a failure are automatically entered by the system to reduce repetitive data entry tasks. SLM is also capable of accepting data from a Process Historian to automatically generate Events such as Demands, Faults/Failures, and Bypasses. The system is designed to allow Users closest to an Event to record the Event.


For example:

  • Operators may be assigned Event entry responsibilities for Demand, Fault/Failure, and Bypass Events
  • A Maintenance Technician or Supervisor may be assigned Event Entry responsibilities for Testing and Maintenance Events
  • Engineering may handle other events such as Status changes or Test Deferrals


SLM allows the User to define whether an Event requires Approval before being used in performance calculations. For Event types that require Approval, the primary and secondary Approvers for each Event Type can be independently defined at the Site or Unit levels.


Each Event record has a check box which is used to identify if an Event that had a failure was a Safety Related Failure. For example: On a test of a SIF, a shutdown valve was found not to close when it was commanded to do so. When the Test data is entered into SLM, the test on the SIF would be identified as a failed test and the Device Event for the valve would also be identified as a failed test. Both Events would be identified as being Safety Related Failures.

All of this provides the user with a continually updated view of the performance of Safety Functions at whatever granularity the user needs. Event entry provides an efficient way to assure that performance information is captured at the source. The overall result is an unprecedented level of continuous, highly efficient Safety Lifecycle monitoring.

How to Manage Bypasses Using SLM

How to Manage Bypasses Using SLM

IEC 61511 Part 1, contains extensive discussions of the design and operating procedures for SIF bypasses. Clause 16.2 describes operational requirements such as:

  • Performing a hazard analysis prior to initiating a bypass
  • Having operational procedures in place for when a protective function has been bypassed
  • Logging of all bypasses.

How to Manage Bypasses Using SLM – through a robust Bypass management and logging function that meets all of the requirements of IEC-61511 and integrates with the performance analysis and reporting functions of the SLM Operate-Maintain (OM) Module. SLM OM Module uses the Bypass Authorization object and Work Flow to initiate, approve and record the execution of Protective Function Bypasses. SLM does not limit the use of Bypasses to just SIFs. In SLM, any protective function may have a Bypass Authorization associated with it.

Read more about the Benefits of Effective Bypass Management 

The figure below illustrates how the Work Flow supports the tasks required on how to manage bypasess using SLM:

A Bypass Authorization is initiated by any authorized SLM user. In practice this will usually be a member of the Operations Staff for a Unit, often a shift foreman or Operations Engineer. The originator is guided to enter the information required to support the Bypass Authorization. This includes:

  • Basic Bypass information such as the reason for the Bypass, the anticipated start date and time and the maximum time which the Protective Function is to be Bypassed
  • Hazard Assessment information – this includes an identification and assessment of the potential severity of hazards that may occur while the Protective Function is Bypassed and the corrective measures that should be taken if the hazard occurs
  • Operation Procedures that are required to be used to mitigate potential hazards that may occur while the Protective Function is Bypassed
  • Identification of the Devices associated with the Protective Function that will be Bypassed

Once this information is provided, the user then may submit the Bypass Authorization for Approval. The Bypass Authorization is submitted to the designated Approver, typically an Operations Supervisor of Manager. The Approver reviews the Bypass Authorization and either Approves or Disapproves the request.

Once the Bypass Authorization is Approved, the Operations team may execute the Bypass as planned. The originator or other authorized user may then record the start date and time of the Bypass in the Bypass Authorization. If a Bypass is expected to exceed the time requested in the original Bypass Authorization submittal, the user may request approval for a Bypass Extension by filling in the data in the Bypass extension section of the Bypass Authorization object. When approved, this will update the authorized Bypass time and prevent the Bypass from being reported as exceeding its authorized time.

When the Bypass is completed, the originator or other authorized user then enters the date and time when the Protective Function is returned to service and then close the Bypass Authorization. Closing of the Bypass Authorization results in the Bypass data being added to the SLM Events that are used to analyze Protective Function and Device performance.

SLM contains performance views that capture all Bypasses for a Function, Unit and Site. The analysis functions include reporting on the number of bypasses, time in bypass and identification of Bypass Events that exceeded the authorized bypass time. SLM will also compute the effect of Bypasses on a Protective Function’s in-service performance, such as computing the in-service reduction in the Functions’ RRF or PFD. Functions that have excessive Bypasses will also show up on the Unit and Site bad actors lists.


Rick Stanley has over 40 years’ experience in Process Control Systems and Process Safety Systems with 32 years spent at ARCO and BP in execution of major projects, corporate standards and plant operation and maintenance. Since retiring from BP in 2011, Rick formed his company, Tehama Control Systems Consulting Services, and has consulted with Mangan Software Solutions (MSS) on the development and use of MSS’s Safety Lifecycle Management software.

Rick has a BS in Chemical Engineering from the University of California, Santa Barbara and is a registered Professional Control Systems Engineer in California and Colorado. Rick has served as a member and chairman of both the API Subcommittee for Pressure Relieving Systems and the API Subcommittee on Instrumentation and Control Systems.

I Like Logic Diagrams

I Like Logic Diagrams

I like logic diagrams, although I’m often in the minority, to do the detailed design of a Safety Instrumented Function (SIF). Others believe that Cause and Effect (C&E) Diagrams are all that is needed. My view is that C&E’s are an effective overview tool when it comes to familiarizing people that aren’t part of the design team with a SIF’s function. However, when it comes to clearly and unambiguously defining how a SIF, or any other logic function works, I find the logic diagram to be the best tool.

C&E’s just are not very good in conveying stuff like timing or sequencing, rather they are quite confusing. C&E’s are good at saying if an input condition exists, this is the output condition. But more complex things such as timing, permissives and other things that usually exist can’t be readily defined in a C&E. Suddenly you are trying to figure out what Notes 6, 12, and 19 actually mean. Users programming from C&E’s, particularly for larger systems can easily make mistakes or misinterpret the intent. I find myself to be quite capable of misinterpreting all those notes.

I like logic diagrams because on the other hand, when done well, they are easy to interpret. The diagram symbols like those identified in a standard such as ISA 5.2 allow the user to clearly define almost everything you need. You can clearly and precisely cover set points, time delays, and complex relationships etc. Personally, I’ve used an amended version where input and outputs get more directly defined as power sources, dead bands for switches, whether the logic operates on an open or closed switch, or energizes or de-energizes a solenoid valve, etc.

Logic diagrams also can become a one to one road map for the Safety Instrumented System (SIS) programming. Most SIS programming languages have a function block option. This makes things a whole lot easier and saves a lot of time in programming, quality checking and field testing. It’s true that preparing a good logic diagram takes more time than putting together a C&E, but it’s my belief that you get your money back and then some just in simplicity and reduced errors. It’s simple to put a note on a C&E that someone might easily misunderstand, but in a logic diagram you have to sweat the details up front and not pass it on for a programmer to figure out (and everyone thereafter).

I think that logic diagrams are an investment. They take time to prepare yet start paying back at the time of programming. The real payout comes at the time of pre-startup validation. With well-reviewed logic diagrams, the potential errors in programming are pretty much beat out of the system by the time you get to checkout, loop testing, and validation. Well checked and tested systems can radically reduce startup time.

An example of what a logic diagram looks like:

A case study I cite is a process unit for which I was the lead control systems engineer. The process required over 100 distinct Interlock, sequence and SIFs as well as required over 400 logic diagrams to represent. We spent a ton of time developing the logic diagrams and a bunch more putting together test procedures and executing them.  We taught the Operators to read the logic diagrams, and during the first 6 months of operation, there was always one set or another open on a desk.

It took a lot of effort, and had real costs, when it was all said and done, we only had two logic glitches during startup (one of those was an unauthorized logic change made by a contract engineer at the last minute). The net result was that we were up and making on spec product in the first week of operation. The licensor’s startup engineers were amazed. Their feedback was that they always experienced that there would be 6 to 8 weeks of logic debugging before reliable production could be established. The extra 5 weeks of production paid for all of time we spent on logic diagrams and testing, many times over. That’s why I like logic diagrams.


Rick Stanley has over 40 years’ experience in Process Control Systems and Process Safety Systems with 32 years spent at ARCO and BP in execution of major projects, corporate standards and plant operation and maintenance. Since retiring from BP in 2011, Rick formed his company, Tehama Control Systems Consulting Services, and has consulted with Mangan Software Solutions (MSS) on the development and use of MSS’s Safety Lifecycle Management software.
Rick has a BS in Chemical Engineering from the University of California, Santa Barbara and is a registered Professional Control Systems Engineer in California and Colorado. Rick has served as a member and chairman of both the API Subcommittee for Pressure Relieving Systems and the API Subcommittee on Instrumentation and Control Systems.

Promoting a Sustainable Process Safety Culture

Promoting a Sustainable Process Safety Culture

Promoting a sustainable process safety culture can be difficult. The Chemical Safety Board just issued their report on the November 2014 incident at the DuPont La Porte plant in which 4 people were killed:

Click here to read the full report.

Summary of the Report 

The report reads like so many others highlighting some issues with promoting a sustainable process safety culture.  The root cause was said to have been the fact that site and corporate management failed to implement Process Safety Management Systems. Furthermore, the report also cites multiple failures in the overall management of Process Safety. The core failure in this incident was that the facility had a very poor Safety Culture as summarized in the excerpt from the CSB Report. The CSB Report devotes an entire section on how the Process Safety deficiencies in this incident parallel the findings in an earlier CSB report on the 2005 BP Texas City Refinery explosion, despite the site being aware of the report and its findings. ®

DuPont La Porte did not use any type of robust, formal process safety culture assessment. Process safety culture can affect whether a site has a sense of vulnerability in terms of process safety management risks; complacency or overconfidence; and transparent, timely, and thorough responses to PSM concerns, action items, and issues, including leadership measures to prevent a “check-the-box” mentality (i.e., simply accomplishing a task as the objective rather than ensuring a high degree of focus on risk management and prevention). The Safety Perception Surveys conducted at the DuPont La Porte facility before the November 2014 incident were designed to lower OSHA total recordable injury rates [59, p. 8]. DuPont did not intend for these surveys to measure or address the perception of process safety performance.

One of the issues with promoting a sustainable Process Safety culture is that it’s hard without the right tools:

  • The tools that an organization typically has to manage day to day operations don’t fit the needs of Process Safety Management.
  • The tools that do exist are typically single purpose and result in isolation of data and limited availability across organizational boundaries.

It’s extremely easy for individuals to become disconnected as they often are not involved in day to day management of Process Safety and it becomes the perception that it’s taken care of by others. Add a management attitude such as existed at La Porte where there was a misplaced emphasis on measuring personnel safety with no corresponding concern for Process Safety and establishment of a sustainable Process Safety culture becomes impossible.

An effective Process Safety Program needs to make Process Safety information widely available to all employees involved in design, operation, and maintenance of the processes in order to keep them all involved on a daily basis. When a site is using the tools traditionally available for plant operations, information becomes isolated from personnel and is difficult to access. 

Safety Lifecycle Manager (SLM®)                                   

The SLM® application was developed to address the many shortcomings relative to Process Safety that exist in many plants today. The origins of the application were a direct result of the CSB and Baker Panel findings relative to the BP Texas City Refinery explosion.

The objectives of the development of SLM were:

  • Unify Process Safety data in one location so it is accessible to all personnel that need it. This includes PHA, LOPA, IPLs, Plant Assets that perform the functions required by IPLs or other functions, and Field Devices that are used to implement the functions and performance records for Plant Assets and Devices.
  • Provide the tools to perform PHA and LOPA studies within the SLM application.
  • Link Plant Assets to PHA, LOPA, and IPL data so the Process Safety requirements such as LOPA IPLs or PHA Safeguards that resulted in the Plant Assets being installed can be directly accessed from Plant Assets and vice-versa. This provides a very clear linkage between real functions and devices in the plant to the Process Safety reasons that they exist. This addresses the very real issue of IPLs not being clearly identified by LOPA Teams, or multiple LOPA teams identifying multiple IPLs that correspond to the same Plant Asset. The figure below illustrates these relationships.

  • Provide engineering tools that support design of safety instrumented systems (SIS) and safety instrumented functions (SIF) and maximize consistency of design. This includes tools to rapidly develop Safety Requirements Specifications (SRS) and evaluate SIF Probability of Failure upon Demand (PFD). Functional requirements for Safety Related Devices are clearly defined as are testing requirements and any operational requirements.
  • Provide the ability to define functional requirements for other non-SIF Protective Functions and Safeguards and their field Devices including alarms, interlocks, BPCS functions and non-instrumented protective functions.
  • Provide the ability to upload or link key documents directly with Process Safety related Assets. These may be operation and testing procedures or other documents or drawings.
  • Provide a complete Life Cycle management capability that allows for management of Protective Functions during operation and maintenance after initial design and installation. Events associated with the operation of Safety Related Plant Assets such as Demands, Testing, Bypasses and Failures may be recorded using simplified and consistent Work Flows. The figure below illustrates the relationship of Events to Plant Assets and Devices.

  • Provide a real time view of the performance of Protective Functions and their field Devices based upon the Event data contained in the database. Various Key Performance Indicators (KPI) allow the plant to understand the current state of performance and manage periodic testing and identify bad actors for which corrective action is required. Examples of various KPI’s are shown below.

How SLM® can help when promoting a sustainable Process Safety Culture

  • Instead of separation of various aspects of Process Safety, they are integrated in one web-based application that makes Process Safety information available to all personnel who have Process Safety interests.
  • SLM® allows personnel with Process Safety responsibilities to participate in Process Safety Management on a routine basis. Furthermore, personnel that are closest to various Events may be assigned responsibility to record those Events.

For example:

Operations personnel are responsible for entering Events for operational related items such as Demands, Bypasses, and Failures while maintenance personnel are responsible for monitoring testing that is approaching its due date as well as entering the results of testing and any other maintenance Events. This keeps personnel involved in the day to day management of Process Safety related Assets.

Rick Stanley has over 40 years’ experience in Process Control Systems and Process Safety Systems with 32 years spent at ARCO and BP in execution of major projects, corporate standards and plant operation and maintenance. Since retiring from BP in 2011, Rick formed his company, Tehama Control Systems Consulting Services, and has consulted with Mangan Software Solutions (MSS) on the development and use of MSS’s Safety Lifecycle Management software.

Rick has a BS in Chemical Engineering from the University of California, Santa Barbara and is a registered Professional Control Systems Engineer in California and Colorado. Rick has served as a member and chairman of both the API Subcommittee for Pressure Relieving Systems and the API Subcommittee on Instrumentation and Control Systems.


How to Use Your Process Historian to Generate Automated Safety Lifecycle Manager (SLM) Events

How to Use Your Process Historian to Generate Automated Safety Lifecycle Manager (SLM) Events

Capturing Events in SLM generally requires manual entry of data by a user. However, this doesn’t need to be the case. It is possible to automatically extract Event data from a Process Historian. Setting it up takes some initial work, but once the setup has been done, the process of Event generation can be automated.

First, the user must have tags that exist in the basic process control system (BPCS) and Historian from which the Historian can capture changes in status. These are status tags that signify that an Event has occurred. A few examples of this are:

  • Alarm Activation
  • Safety Instrumented Function (SIF) Demands
  • Manual Trip Commands
  • SIF Bypasses
  • Fault/Failure Diagnostics
  • BPCS demands

In order to leverage this functionality, the underlying BPCS, Safety Instrumented System (SIS) alarm, and status tags need to be developed. See example in the figure below:


Then, once the necessary status data is available in the Historian, an external scanning program needs to be developed that will scan the Historian data for a set of tags on some routine basis, typically daily, but other intervals may be chosen.

The scanning program exports a file with a list of all status changes that occurred over the scan interval. Typically, this file contains the tag number of the tags associated with the status change, the status change (e.g. from Normal to Tripped, Normal to Bypass, Bypass to Normal, etc.) and the time stamp of the status change. On the SLM side, another program, the SLM Import Adapter, examines the Historian export file and generates the associated Event in SLM. In order to do this, SLM needs to have a table of the tags which may have a status change and enough information to allow SLM to generate the Event. Some of the information required is:

  • The Historian tag name and the SLM object name – These should be the same, but there is no guarantee they will be.
  • The type of Event with which the Historian tag is to be associated (e.g. Demand, Bypass, etc.)
  •  A list of Devices associated with the SLM object name for which SLM should create Device Events
  • Whether the Event is to be directly logged in SLM or submitted for Approval.

The SLM Import Adaptor is then used to generate the SLM Events. The Adaptor handles the messy behind the scenes details of creating the Events and any linkages to SLM Parents or Children. 

However, it should be noted that Historian tag status data cannot always provide all the data that a user may want to support SLM’s performance analysis and reporting functions.

For example, a SIF Demand Event generated from Historian data will record a SIF Demand in SLM, but probably won’t have enough data available to verify whether the Demand was executed successfully or identify what Devices were involved in the Demand.

It will usually be necessary for a user to review the automatically generated Event data and supplement it with additional information such as Pass/Fail status or creating or editing Device Events that should be associated with a Demand. This can be addressed by requiring that all automatically generated Events be entered into the SLM database as requiring Approval. This clearly identifies that new Events have been created and allow for review and completion prior to finalizing the Event.

While we have been discussing how SLM Events can be generated from Historian data, the same concepts can be applied to other Events such as Testing and Maintenance Events where data can be extracted from a Site’s Maintenance Management System and imported to SLM Events. 

Rick Stanley has over 40 years’ experience in Process Control Systems and Process Safety Systems with 32 years spent at ARCO and BP in execution of major projects, corporate standards and plant operation and maintenance. Since retiring from BP in 2011, Rick formed his company, Tehama Control Systems Consulting Services, and has consulted with Mangan Software Solutions (MSS) on the development and use of MSS’s Safety Lifecycle Management software.
Rick has a BS in Chemical Engineering from the University of California, Santa Barbara and is a registered Professional Control Systems Engineer in California and Colorado. Rick has served as a member and chairman of both the API Subcommittee for Pressure Relieving Systems and the API Subcommittee on Instrumentation and Control Systems.

When Should You Conduct a Functional Safety Assessment (FSA)?

When Should You Conduct a Functional Safety Assessment (FSA)?

When Should You Conduct a Functional Safety Assessment (FSA)?

The ISA 84.01.00 and IEC 61511 ed. 2, Part 1, clause 5.2.6 safety standards require that every safety instrumented system (SIS) shall have a Functional Safety Assessment (FSA) performed prior to being placed into service.  A FSA is required in order to provide assurance that a SIS has been specified, designed, and tested in accordance with all phases of the Safety Lifecycle. These Standards identify 5 stages at which an FSA may be performed.

 The 5 STAGES


However, as is the case with safety standards, they don’t exactly explain when to perform the assessment rather leave the actual scheduling to the User. It is important to consider factors such as size, complexity experience, etc.


Important Factors to Consider:

  • If an organization is new to managing the Safety Lifecycle, it is a really good idea to conduct a FSA at each of the Stages identified in the Standards:

1.) First, after the HAZOP and LOPA’s have been performed and the Safety Requirements Specification (SRS) has been developed, perform the Stage 1 FSA on those items.

2.) Next, after the SIS design has been completed, perform the Stage 2 FSA on the design.

3.) Then, prior to startup, perform a Stage 3 FSA to assess the installation, testing and validation of the SIS and its Safety Instrument Functions (SIF).

This incremental process allows the newbie organization to learn about FSA’s and allows the organization to close any gaps identified with a minimum of impact on the overall project.

  • The same multiple stage procedure should also be followed on large projects where the SIS is only part of a larger design. Larger projects develop a momentum therefore, timely checks on the compliance of SIS specification and design are necessary to avoid substantial impacts on the project schedule and avoid expensive re-work.
  • An organization that is very experienced with SIS design and ownership may choose to defer the FSA until prior to startup. This scheduling assumes that the organization has well defined Safety Lifecycle procedures and standards and therefore have confidence that an FSA performed late in the SIS specification and design process will not identify serious gaps that might delay the startup. 
  • If a new SIS is being installed on an existing process or an existing SIS is being modified, it is usually during a unit turnaround. SIS and SIF testing and validation is usually the last step, so it is important to keep in mind that the operations team that takes part in the startup process might not appreciate waiting on an FSA.

This is why it’s a really good idea to have the FSA completed except for final items such as testing, validation and training assessments. This allows the FSA team to do a quick final assessment of these items and provide that necessary “Functional Safety has been achieved” guidance.

ADDITIONAL CONSIDERATIONS with STAGE 4:

It’s important to recognize that throughout the service life of a SIS, multiple Stage 4 FSA’s will need to be performed to assess in-service performance. Once again, the standards don’t define how often this occurs. We can figure on a nominal 4-5 years between Stage 4 FSA’s, but it all depends upon the process requirements and actual experience.  A poorly performing SIS or SIF may need more frequent assessments. The Stage 4 FSA’s should generally be scheduled ahead of turnarounds to allow time for any needed corrective measures to be implemented within the turnaround.  All this requires the performance data of the SIS (demands, failures, faults, testing history, etc.) be kept, managed, and organized in a quickly accessible manner. 

 Rick Stanley has over 40 years’ experience in Process Control Systems and Process Safety Systems with 32 years spent at ARCO and BP in execution of major projects, corporate standards and plant operation and maintenance. Since retiring from BP in 2011, Rick formed his company, Tehama Control Systems Consulting Services, and has consulted with Mangan Software Solutions (MSS) on the development and use of MSS’s Safety Lifecycle Management software.

Rick has a BS in Chemical Engineering from the University of California, Santa Barbara and is a registered Professional Control Systems Engineer in California and Colorado. Rick has served as a member and chairman of both the API Subcommittee for Pressure Relieving Systems and the API Subcommittee on Instrumentation and Control Systems.