

Risk Graph SIL Determination
Structured SIL Determination Using Risk Graphs
The Risk Graph SIL Determination module provides a structured way to determine Safety Integrity Levels. It evaluates hazards using consequence, exposure, avoidance, and demand to ensure consistent, traceable, and well-documented SIL decisions across all safety lifecycle stages.
Execute SIL Determinations Using the Risk Graph
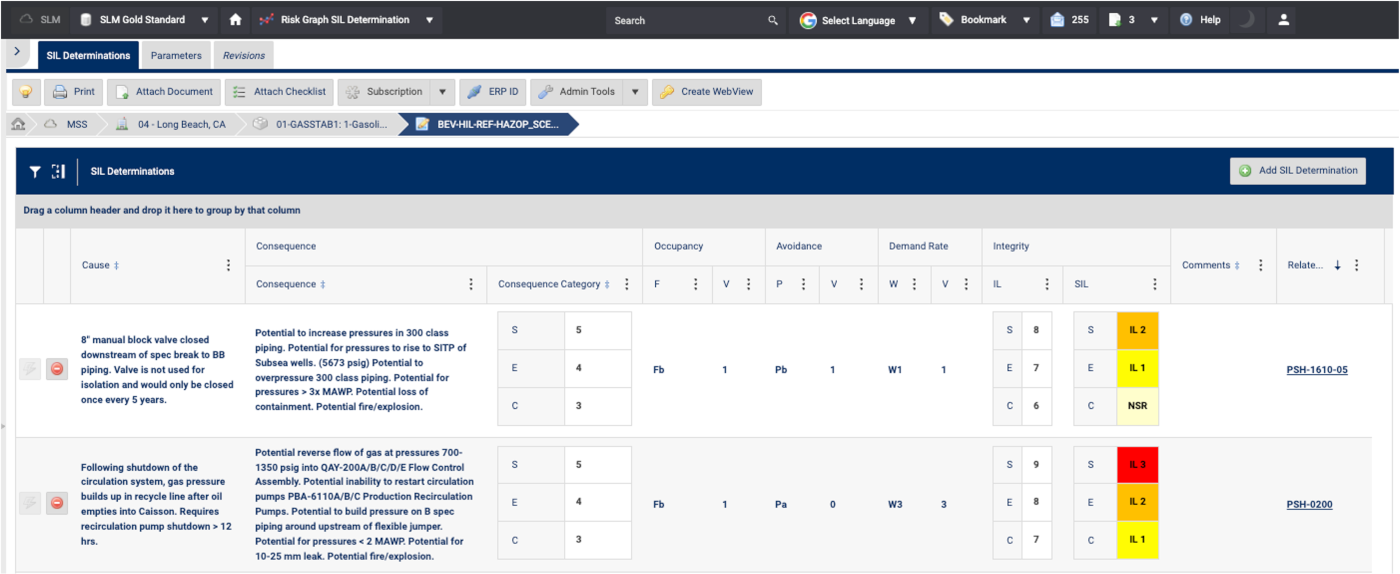
Perform SIL determinations directly within the risk assessment workflow using the configured Risk Graph methodology. Users can evaluate each hazard scenario by selecting the appropriate consequence severity, occupancy, avoidance probability, and demand rate parameters. The system automatically determines the resulting integrity level and required SIL, ensuring consistent and traceable application of the Risk Graph methodology across SIL assessments.
Click to zoom image
Risk Graph SIL Determination Methods
SIL determination methods provide a structured approach for establishing the level of risk reduction required for a Safety Instrumented Function (SIF). These methods help organizations evaluate process hazards, assess consequence severity, consider existing protection layers, and document how safety targets are selected. Selecting an appropriate methodology is an important part of demonstrating compliance with IEC 61511 and maintaining a consistent functional safety program.
Several approaches are commonly used across the process industries, including risk graphs, risk matrices, risk tables, and Layer of Protection Analysis (LOPA). Each method offers a different balance of complexity, consistency, and analytical rigor depending on project requirements and available risk information.
Risk Graph SIL Determination Method
The Risk Graph method uses a structured decision tree to determine the appropriate safety integrity target for a hazardous scenario. Factors such as consequence severity, frequency of exposure, probability of avoiding the hazard, and demand rate are evaluated through predefined categories that guide the user toward a recommended result.
Because the methodology is straightforward and repeatable, it is commonly used during early project phases and within organizations seeking a consistent approach across multiple facilities. Risk graphs provide a documented and auditable decision process while reducing subjectivity between different study teams.
Risk Tables and Risk Matrices
Risk tables and risk matrices are commonly used to evaluate hazards by comparing consequence severity against likelihood or frequency. These methods help teams categorize risk levels and determine whether additional safeguards or protective functions are required.
Organizations often customize risk matrices to align with corporate risk tolerance criteria, allowing engineering teams to apply consistent decision-making across projects. Risk matrices can also serve as a useful screening tool before more detailed analyses such as LOPA or quantitative risk assessments are performed.
Risk Graph vs LOPA
Both Risk Graphs and Layer of Protection Analysis (LOPA) are used to support safety-related decision making, but they differ in their level of detail. Risk Graphs provide a structured qualitative method for determining required risk reduction based on predefined criteria. They are typically faster to apply and require fewer input parameters.
LOPA is a semi-quantitative methodology that evaluates initiating events, consequence severity, independent protection layers, and risk reduction credits in greater detail. While LOPA generally requires more effort to perform, it can provide a more granular assessment of risk and protection layer effectiveness.
For teams that need a more detailed semi-quantitative workflow, Mangan also provides LOPA software to support protection layer analysis and related SIL determination activities.
Many organizations use both approaches within their functional safety programs. Risk Graphs may be applied during initial hazard evaluations, while LOPA is used for scenarios requiring more detailed analysis. For additional guidance, review our SIL Determination Explained guide, our Safety Integrity Levels (SIL) Explained resource, and our IEC 61511 overview.
Risk Graph SIL Determination FAQs
What is a Risk Graph?
A Risk Graph is a structured decision-making method used to determine the level of risk reduction required for a hazardous scenario. The methodology evaluates factors such as consequence severity, frequency of exposure, probability of avoiding the hazard, and demand rate to support consistent safety-related decisions. Risk Graphs are commonly used in process safety and functional safety programs because they provide a repeatable and auditable approach to determining safety requirements.
How Does the Risk Graph Method Work?
The Risk Graph method guides users through a series of predefined decision criteria to evaluate the potential consequences and likelihood of a hazardous event. By assessing parameters such as consequence severity, exposure, avoidance capability, and demand frequency, the method helps determine the level of risk reduction needed to achieve an acceptable level of risk. Organizations often use Risk Graphs during hazard analysis activities and early safety lifecycle phases.
What Is a SIL Risk Table?
A SIL Risk Table is a structured matrix used to evaluate risk and determine the appropriate Safety Integrity Level (SIL) for a Safety Instrumented Function. Risk tables typically compare consequence severity with likelihood or frequency criteria to establish risk categories and required safety performance targets. They are often used alongside other determination methods such as Risk Graphs and Layer of Protection Analysis (LOPA).
What Are Common SIL Determination Methods?
Common SIL determination methods include Risk Graphs, SIL Risk Tables, Risk Matrices, Layer of Protection Analysis (LOPA), and quantitative risk assessment techniques. The most appropriate methodology depends on project requirements, available data, organizational standards, and regulatory expectations. Many organizations use multiple methods throughout the safety lifecycle to support consistent and well-documented decision making.
For a detailed explanation of the methodologies, assumptions, and lifecycle considerations involved, see our SIL Determination Explained guide.
When Should a Risk Graph Be Used Instead of LOPA?
Risk Graphs are often used when organizations need a consistent and efficient method for evaluating hazards and establishing safety targets. LOPA provides a more detailed semi-quantitative analysis that evaluates initiating events and independent protection layers. Many companies use Risk Graphs during initial hazard evaluations and apply LOPA to scenarios requiring additional analysis or verification. Both methods can be valuable components of an effective functional safety program.
Configurable Risk Graph Parameters
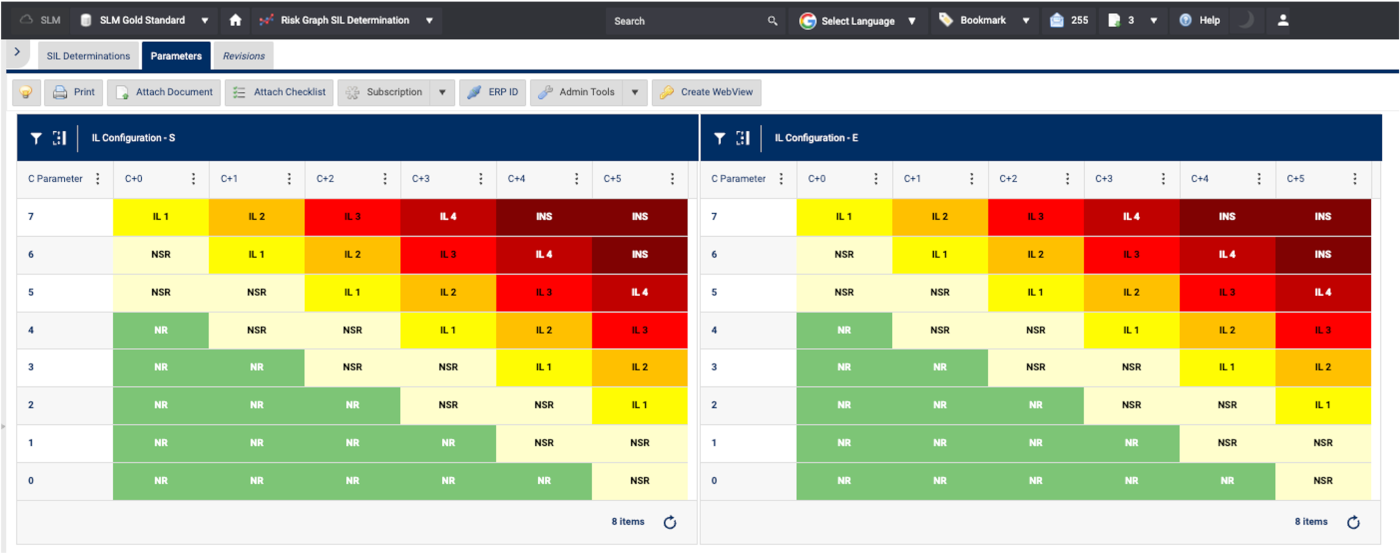
Define how SIL requirements are determined using configurable Risk Graph parameters. Establish the consequence, frequency, probability of avoiding the hazard, and demand rate parameters used in the Risk Graph methodology. By configuring these inputs, companies can align SIL determination with their internal risk criteria and corporate safety standards while ensuring consistent application of the methodology across risk assessments.
Click to zoom image
SIL Determination Reporting
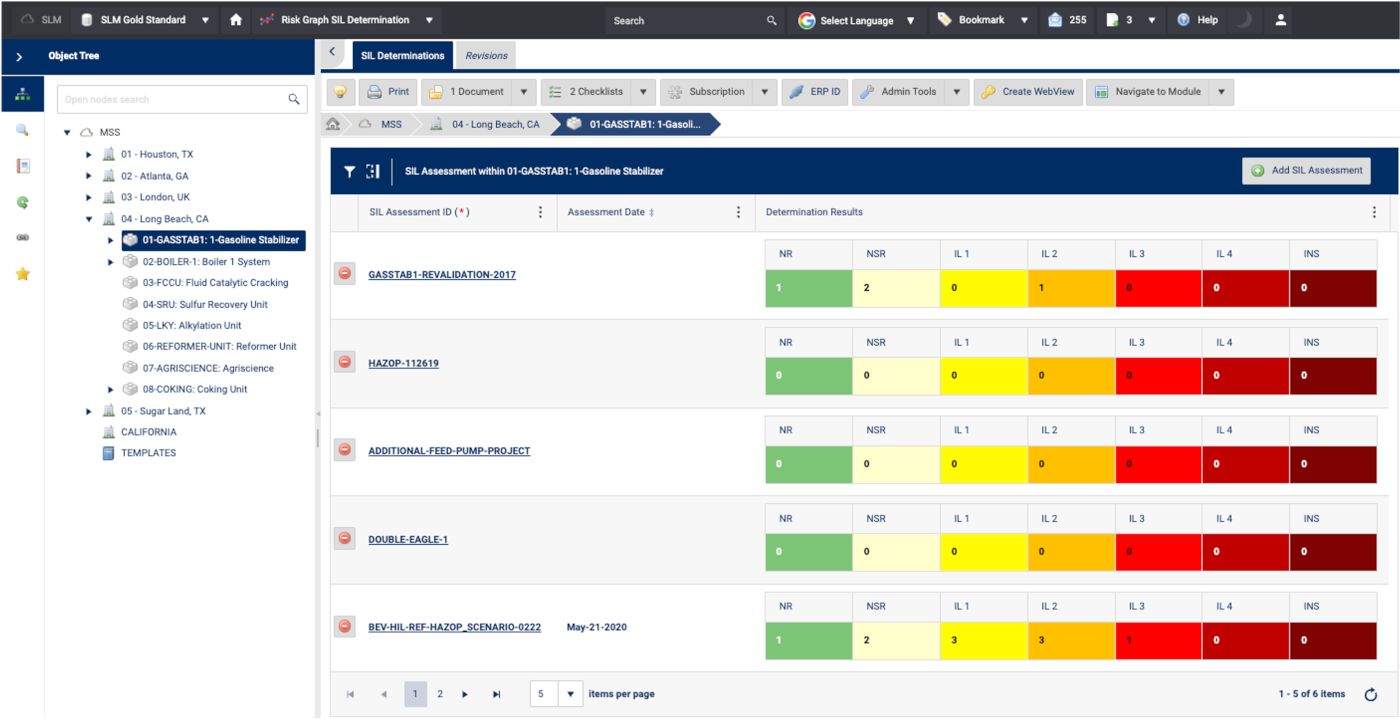
View and report on SIL determinations across units and assessments. The module provides a clear summary of SIL assessment results, allowing users to quickly see how many scenarios fall within each integrity level category. This reporting capability helps organizations track assessment outcomes, review risk profiles across the facility, and maintain clear documentation of SIL determination activities.
Click to zoom image
Understanding Risk Graph SIL Determination in Practice
Risk Graph SIL determination is widely used across the process and functional safety industries to provide a consistent and structured approach to assigning Safety Integrity Levels. By evaluating key factors such as consequence, exposure, avoidance, and demand rate, organisations can ensure that their safety functions are aligned with real operational risks.
This method is commonly referenced in international functional safety practices, particularly in relation to IEC 61511, which defines lifecycle expectations for Safety Instrumented Systems in the process industries. Applying a structured Risk Graph SIL approach helps improve consistency, traceability, and auditability throughout the safety lifecycle.
Using dedicated software to manage Risk Graph SIL assessments further enhances efficiency by standardising calculations, reducing manual errors, and ensuring all decisions are fully documented. This allows teams to maintain compliance while improving the overall quality and reliability of safety studies
Additional background on functional safety lifecycle requirements can be found through the International Electrotechnical Commission (IEC), which publishes the IEC 61511 standard used throughout the process industries.
Related Functional Safety Resources
BLOG & ARTICLES
Stories that Drive Innovation
Discover how our software solutions enable smarter decision-making, operational excellence, and compliance across the world’s most complex industrial environments.